Yearly Shapes
Menu
Option:
General:YearlyShapes
See
also:
Time
Slices,
System
Energy Load Shape,
System
Peak Load Shape,
Demand
Load Shape,
YearlyShape
Function
The yearly shapes screen is used to view and edit a library of any number
of different shapes that can be used to specify how values vary by season
and time of day within a year. Yearly shapes are most typically
used to specify system or device load shape but they can also be used
to specify seasonal and time of day variations for variables such as the
availability of processes or the merit order of dispatch of processes.
Each yearly shape is specified by entering values corresponding
to different time slices within a year. Use the General: Time
Slices screen to specify how a year is subdivided into different time
slices. You can specify any number of different yearly shapes. Later
you will assign these to different demand devices or to different variables
within your Transformation analysis typically by entering an expression
based on the YearlyShape function.
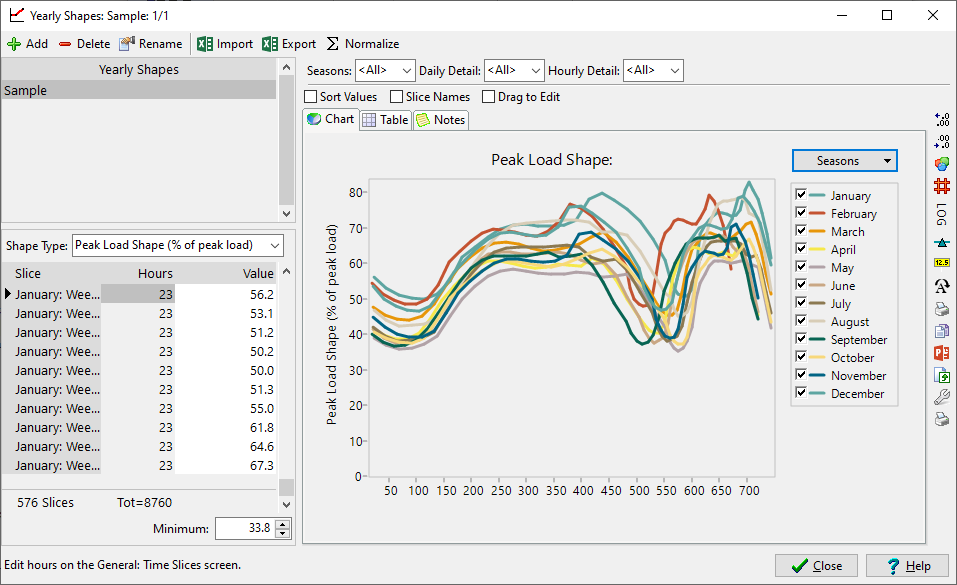
The Yearly Shapes screen consists of three areas:
Peak
Load Shapes (% of peak load)
Energy
Load Shapes (% of annual energy load)
Availability
shapes (% availability 0..100%) used to describe the fraction
of time a plant is available in each time slice.
Merit
Order shapes (integer values 0,1,2,...N) used to describe the
merit order of dispatch of power plants.
At the right of the screen you will see a chart and table previewing
the current yearly shape. You can also access a tab in which you
can enter notes documenting the shape. When displaying charts and
tables, you can use the tool bar on the far right of the screen to customize
the charts and tables. Charts can also be configured to display
slice names or hourly values on the X axis and optionally can also be
sorted to display loads from the highest to the lowest (a load duration
curve). You can also filter the chart to show one or all of the seasonal,
daily and hourly groupings. On the chart legend you can select
to show the whole year or to show separate lines for seasonal, daily or
hourly groupings.
 ) to add a
new yearly shape. Click the delete button (
) to add a
new yearly shape. Click the delete button ( ) to
delete a yearly shape. Click the rename button (
) to
delete a yearly shape. Click the rename button ( ) to rename
a yearly shape. Click on the Excel button (
) to rename
a yearly shape. Click on the Excel button ( )
to export one or all shapes to an Excel worksheet. You can also
import a yearly shape from standard hourly load shape profiles, such
as those disseminated by ITRON,
EPRI and other companies.
)
to export one or all shapes to an Excel worksheet. You can also
import a yearly shape from standard hourly load shape profiles, such
as those disseminated by ITRON,
EPRI and other companies.