Menu
Option: General: Regions (also shown on the main toolbar)
See
Also:
Region Groupings,
Maps
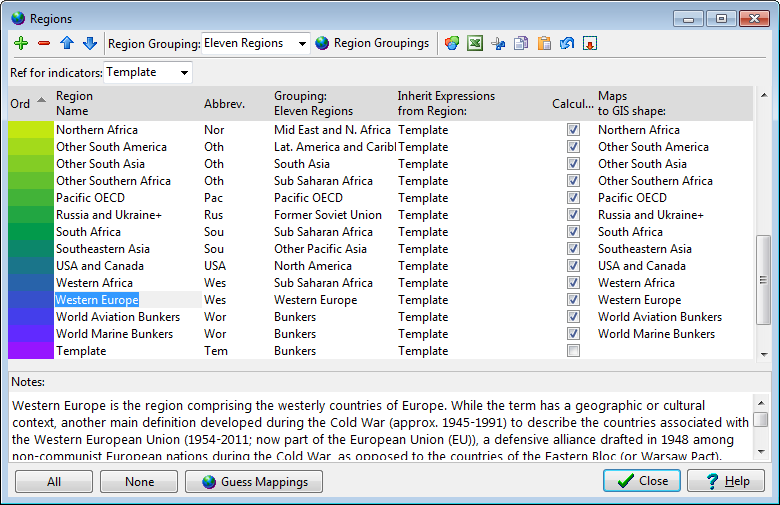
LEAP allows you to specify multiple regions within an area. So for example, if you are doing a regional analysis then each region might be one country, if you are doing a global analysis (as shown above) then each region might be a collection of countries, or if you are doing a country-level analysis then each region might be a different state or province.
If you have specified that your Area is a multi-national application (on the Settings screen) then the Regions screen will assist you as you type in the region names by suggesting the predefined names of known countries and auto-completing the abbreviation column based on each country's two letter (Alpha 2) ISO Code. Alternatively, you can add or edit a region name by selecting from a pull-down list of known country names. In addition, if you are using the IBC Impacts Calculator extension, then an additional read-only column will be displayed indicating whether IBC currently supports each selected country. This column is marked "Works with IBC".
Each region is a separate data dimension, so you can specify different data for each region and view results either for one region or summed across regions. The Region Groupings screen lets you specify up to four named groups of regions for the purposes of reporting in the Energy Balance and Results views. So for example, if you create a global analysis, you could specify each region as a country and then specify regional groupings for Europe, North America, Africa, Latin America, Asia, etc.
In addition to allowing you to enter different data for each region, the regions feature also allows regions to inherit expressions from one region to another for a given branch/variable/scenario expression. So for example, you might specify that region "South" inherits expressions from region "North". In this case you only need to enter data for region South where it differs from region North. This can greatly simplify data entry and model management. In the example shown above each region inherits its expressions from a region named "template".
Both the region and region grouping features are optional. If your data set contains only one region (which is true of any data set created in older versions of LEAP), then regional dimensions will not appear in the results or energy balance reporting views.
Check or uncheck the Calculated field to determine which regions are actually calculated for display in the Energy Balance and Results views. In the example shown above, all regions except the dummy "template" region are checked on.
The color/order column shows you the color and pattern with which any
results for a region will be displayed. You can also use the Color Palette button ( ) to switch the color palette
being used. This will affect all of the colors on this screen and
in all of the charts displaying results.
) to switch the color palette
being used. This will affect all of the colors on this screen and
in all of the charts displaying results.
Click the  button to add
a new region. Click the
button to add
a new region. Click the  button to delete a region.
Bear in mind that this will erase all of the data associated with
a region. Click the
button to delete a region.
Bear in mind that this will erase all of the data associated with
a region. Click the  and
and
 buttons to change the display ordering
of regions.
buttons to change the display ordering
of regions.
When editing an area marked as a Global or Multi-national data set (via the Scope & Scale tab on the Settings screen), you can make use of a pull-down list of pre-defined country names to help you fill the first region name column. When you select one of the pre-defined country names, LEAP will automatically fill the Abbreviation column with the standard two-letter code for that country. You can manually override these names. In Global and Multi-national areas, an additional read-only column will also be displayed with check marks indicating whether the country you selected is currently set up to work with the Integrated Benefits Calculator extension (IBC). You cannot edit this data - it is provided only to give you feedback on whether your area can be used in conjunction with IBC.
You can sort the table by name, abbreviation or grouping by clicking on the appropriate column title. A sort indicator is displayed in the column title to show which column is used to sort the table. The indicator shows the sort order using a triangle pointing up for ascending or down for descending sorts.
To rename a region, simply edit its name. Click the  button to
export the regions table to Microsoft Excel. Click the ditto button
(
button to
export the regions table to Microsoft Excel. Click the ditto button
( )
to duplicate a field value from the value immediately above it.
)
to duplicate a field value from the value immediately above it.
In addition to using charts and tables to display results, in multi-region data sets you can also optionally display LEAP results on a color code GIS (Geographical Information System) map.
Maps are only available if certain conditions are met:
You are working on a multi-region area (i.e. one with more than one region).
You have chosen a GIS "shape" file in the General: Settings: Mapping screen.
If the above conditions are met, an additional column of data will be displayed in the Regions screen with which you can map each region in your area to a shape in the selected GIS shape file. Each LEAP region can be mapped to one and only one GIS shape, so you will need to choose a GIS shape file that has the same level of regional disaggregation as your LEAP area.
Use the Guess Blank GIS Mappings button at the foot of the Regions screen to have LEAP attempt to guess the LEAP-to-Shape File mappings by matching the names used in LEAP to those used in the GIS shape file.
Once you have linked your regions to a shape file in this way, you can then display results in various types of maps in the Results View. These maps are selected as additional chart types in the Results View.