Tagging Branches
See
also: Manage Tags
Menu Option: Tree: Tags
In addition to organizing your analysis using
LEAP's tree structure (e.g., organizing a demand analysis into sectors,
sub-sectors, end-uses and technologies) you can also use tags ( ) to help organize your
data. While the hierarchy of LEAP's tree structure is most useful
for organizing data that can clearly be assigned to single categories
(folders), tags can be helpful for classifying technologies that belong
to more than one category.
) to help organize your
data. While the hierarchy of LEAP's tree structure is most useful
for organizing data that can clearly be assigned to single categories
(folders), tags can be helpful for classifying technologies that belong
to more than one category.
Consider the example of an electric generation
Transformation module. You may decide to create a very long list
of processes ( ) to represent the various types of electric
generation technologies that currently exist or that may perhaps be built
in the future. Some of these technologies may represent specific
individual power plants, while others may represent generic types of power
plants. These technologies need to be entered in LEAP as a single
long list (since LEAP's Transformation branches do not allow for creating
sub folders). Without tags, viewing the results for Electric Generation
would be a challenge since you would have to view results for each individual
process.
) to represent the various types of electric
generation technologies that currently exist or that may perhaps be built
in the future. Some of these technologies may represent specific
individual power plants, while others may represent generic types of power
plants. These technologies need to be entered in LEAP as a single
long list (since LEAP's Transformation branches do not allow for creating
sub folders). Without tags, viewing the results for Electric Generation
would be a challenge since you would have to view results for each individual
process.
This is where tags come in. You can assign
one or more tags to each branch and then use these tags to filter and
organize your results. In the example above, you might chose to
tag your power plants according to whether they were thermal, renewable
or nuclear technologies, or whether they were existing, or new types of
power plants. You might also choose to tag them depending on whether
they were specific power plants in the area being studied or whether they
were generic types of technologies (for example, by assigning the tags
"specific" and "generic"). You may even choose
to tag the power plants based on their technology (for example, Combustion
Turbine, Combined Cycle, IGCC, CCS, etc.) Thus, tags give you a
lot of flexibility in how to categorize branches. When using tags
for viewing results, each branch must only be tagged with a single tag
from any one tag group. Once you have
created tags at different branches, you can use Tags as an additional
selectable dimension in your Results
View charts and tables.
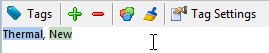
To create tags in LEAP, use the tag toolbar
in Analysis View (shown above). You
can simply type in a set of labels to represent each of your tags separated
by commas. Alternatively you can add an existing tag using the  Add button, or delete a tag using
the
Add button, or delete a tag using
the  Delete button. You can organize
your tags into color coded groups using the Manage
Tags screen (Alt+T). Use the Tag Painter button (
Delete button. You can organize
your tags into color coded groups using the Manage
Tags screen (Alt+T). Use the Tag Painter button ( ) to "paint" tags
by first selecting a branch containing the tags you want to paint, and
then selecting one or more of those tags to "paint" onto other
branches. When in tag painting mode, hover over a branch to see
its name and what tags it currently has. Press Escape or click outside
of the tree to exit Tag painting mode. Use the Color button (
) to "paint" tags
by first selecting a branch containing the tags you want to paint, and
then selecting one or more of those tags to "paint" onto other
branches. When in tag painting mode, hover over a branch to see
its name and what tags it currently has. Press Escape or click outside
of the tree to exit Tag painting mode. Use the Color button ( )
to display the Tree using the colors associated with particular Tag Groups.
If you don't want to color code the tree, select "None".
Use the Tag Settings options to select how tags are applied. Use
the Add To Existing Tags option
to select if tags are added to the set of tags already associated with
a branch, or if the tags replace the existing tags at a branch. Use
the Tag Children option to select
if tags are applied to the current branch and all children below it or
to the current branch alone. This option affects both adding and
deleting of branches. Finally, a Delete
All option (
)
to display the Tree using the colors associated with particular Tag Groups.
If you don't want to color code the tree, select "None".
Use the Tag Settings options to select how tags are applied. Use
the Add To Existing Tags option
to select if tags are added to the set of tags already associated with
a branch, or if the tags replace the existing tags at a branch. Use
the Tag Children option to select
if tags are applied to the current branch and all children below it or
to the current branch alone. This option affects both adding and
deleting of branches. Finally, a Delete
All option ( ) allows you to delete all tags at
all branches.
) allows you to delete all tags at
all branches.