Menu
Option: View: Energy Balance
See also: Energy
Balance View, Energy Balance Chart,
Sankey Diagrams
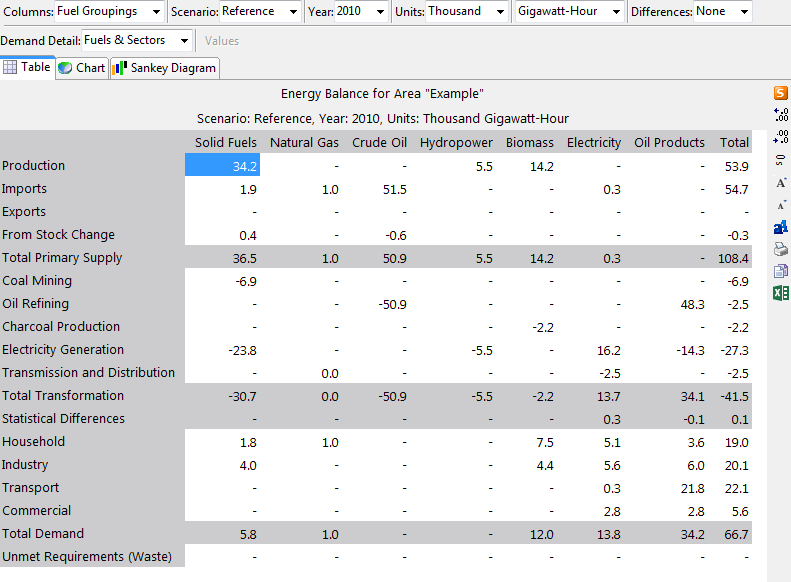
Results in LEAP can be displayed in standard format energy balance tables that closely match the types of tables used by organizations like the International Energy Agency (IEA) and Eurostat as well as many national energy ministries. Energy Balance tables in LEAP are divided into 5 main sections: Supply, Transformation, Statistical Differences, Demand and Unmet Requirements. These are further described below:
Supply: The first section shows
indigenous production of primary resources
as well as imports and exports. Exports are shown as negative values
by convention.
If you place a check mark next to the option "Statistical Differences
and Stock Changes", on the Scope & Scale tab of the Settings
screen you can also specify data on supplies of energy from stocks
of the fuel in the area. Net increases in stocks are shown as
negative values. Typically stock changes are assume to only be able
to meet demands over a fairly short time frame (days, weeks or perhaps
months). Thus they are normally only relevant for current accounts
(historical) data and can be assumed to be zero on average in future-looking
scenarios.
In multi-region areas, imports and exports will each be split into
two rows. Imports are divided into (1) imports from within the
rest of the area and (2) imports from beyond the area (i.e. the rest
of the world). Exports are divided into (1) exports to the rest
of the area and (2) exports to the rest of the world. The various
governing calculation of in-area and out-of-area energy trade are
the In-Area Import
Fraction and In-Area
Export Fraction variables specified under the Resource branches
in Analysis View.
Transformation: The second section shows the energy consumed and produced during the conversion of primary resources into secondary fuels, as well as the energy lost during the transportation and distribution of fuels. Each row corresponds to a Transformation module (listed in reverse of the order shown in the Analysis View). Energy inputs to a module are shown as negative values, outputs are shown as positive values, and the net losses from each module are thus shown in the "total" column on the far right of the balance.
Statistical Differences show the difference between supplies and demands. As with stocks changes, statistical differences only appear in the energy balance if you place a check mark next to the option "Statistical Differences and Stock Changes", on the Scope & Scale tab of the Settings screen and then specify data for the various statistical differences. Typically statistical differences are only relevant for current accounts (historical) data since they reflect differences in statistics between estimates of demand and supply. Normally in future-looking scenarios, statistical differences are assumed to be zero.
Demand: Each row of the demand section shows the sum of final demand in one of the top level branches of the demand tree (i.e. a sector). A selection box also allows you to show different levels of detail for demand data: namely, fuels only (i.e. total final demand), fuels & sectors, or fuels, sectors and subsectors.
Unmet Requirements. In some cases you may have an energy balance where some demands remain unmet (i.e. supply is less than demand), perhaps due to capacity restrictions in a Transformation module. These unmet demands are displayed as positive values in the Unmet Requirements row. Conversely, this same row also shows energy wasted (i.e. where supplies exceed demands) as negative values. Note that most standard energy balance tables deal only with historical statistics and so typically do not include a row for unmet requirements, whereas tables in LEAP also consider future-looking scenarios that may involve demand-supply imbalances.
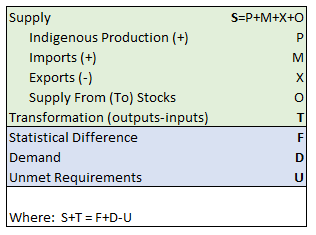
The overall accounting in an energy balance table is summarized in this figure:
For more information on the energy statistics and energy balances we recommend reading the IEA's Energy Statistics Manual, available here.
By default, the columns of the energy balance table are the aggregate fuel groupings defined in the General: Fuel Groupings screen. You can also display detailed fuels, years or even regions as the columns of the energy balance table. When showing years or regions, the energy balance shows the total energy flows summed across all fuels.
LEAP provides a range of options for configuring the energy balance
table including the ability to increase ( ) and decrease
(
) and decrease
( )
the number of decimal places in which values are shown, to adjust the
fonts used in the table, to set the energy units, to show/hide zero values
and to print (
)
the number of decimal places in which values are shown, to adjust the
fonts used in the table, to set the energy units, to show/hide zero values
and to print ( ), copy (
 ), or export
the table to Excel (
), or export
the table to Excel ( ). When
exporting energy balances to Excel you are given the option of exporting
one balance or of exporting all balances at the same time (i.e. one for
each year or one for each region and year in a multi-region area). When
exporting all, each balance will be exported to a separate sheet (tab)
in an Excel workbook.
). When
exporting energy balances to Excel you are given the option of exporting
one balance or of exporting all balances at the same time (i.e. one for
each year or one for each region and year in a multi-region area). When
exporting all, each balance will be exported to a separate sheet (tab)
in an Excel workbook.