See also: View Bar, Summaries View, Decomposition Reports, Marginal Abatement Cost Curve (MACC) Reports
The cost-benefit summary report is a specialized report available from the Summaries View screen in LEAP. It cannot be deleted, and you cannot alter its rows. Note also that the cost-benefit summary report can only be viewed when at least two scenario have been created.
The cost-benefit summary report view displays a comparative overview of the costs and benefits of each calculated scenario in your analysis, compared to a chosen reference scenario . Typically you will choose a scenario representing a baseline (policy neutral) counter factual scenario.
The cost-benefit summary displays a tabular report showing the incremental cumulative costs of each scenario summed across all of the study years, with each cost discounted to the base year at the user-specified discount rate. You can change the default discount rate to see how this effects the cost-benefit calculations. You can also change the monetary unit in which the summary is reported. Use the Units menu option to create your own currency units.
The cost-benefit summary shows costs and benefits for each Demand sector, and each Transformation module , as well as the those derived from the indigenous production, import and export of fuels and resources in the Area. It also shows total costs for the system as a whole and the overall benefit/cost ratio of each scenario. The cost summary will also optionally compare the environmental externality costs of each scenario. If you want to include these costs, make sure that you check off "Include Externality Costs" on the costing tab of the Settings screen, accessed from the main menu. To edit the externality values assumed for each pollutant, go to the General: Effects screen.
Costs relative to the baseline scenario are shown as positive values, while benefits are shown as negative values, It is important to remember that costs are only incurred when there are physical differences between scenarios AND when unit costs for those differences have been entered. Thus, it is possible for scenarios to differ physically but not in terms of costs. For example, this might occur if you do not specify the unit cost of resources or the unit cost of generating capacity. Be sure to enter all appropriate unit costs in the Demand, Transformation and Resource data entry tables before using the cost summary.
At the bottom of screen, the cost summary displays the total cumulative emissions of all greenhouse gases avoided by each scenario (shown in terms of the global warming potential of those pollutants in tonnes of CO2 equivalent). By default, LEAP uses the 100 year integration global warming potential factors suggested by the IPCC. You can change these assumptions, on the Effects screen. The cost summary also displays the overall cost of saving CO2 emissions in each scenario (with and without the cobenefits of avoided emissions of non-greenhouse gas pollutants).
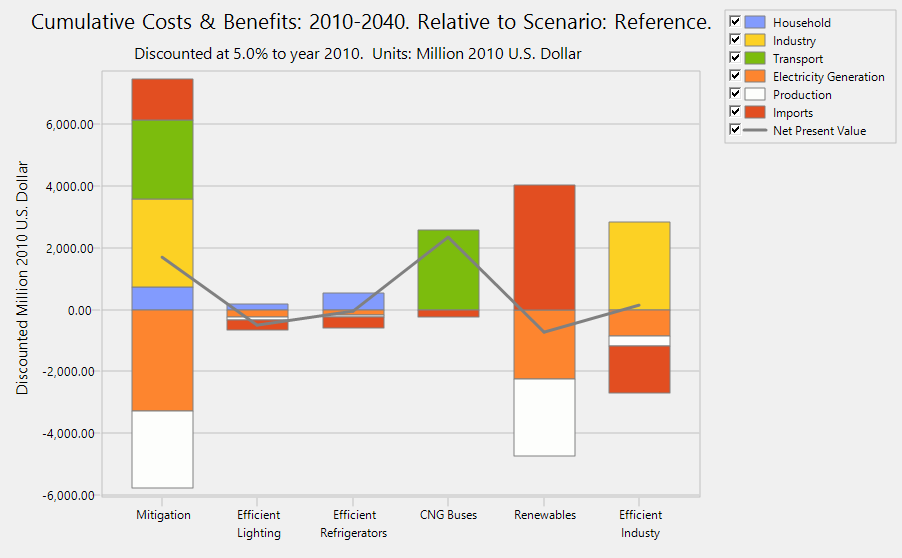
In addition to being displayed in table format, the cost-benefit summary can also be shown in chart format as shown below. In this chart, net costs are shown above the X axis and net benefits (savings) below the X axis. Each series in the chart shows the net costs or benefits of different sector. The net present value for the whole scenario is plotted as a line on the chart.