Menu Option: View: Overviews
See also: View Bar , Overview Manager, Scenario Explorer
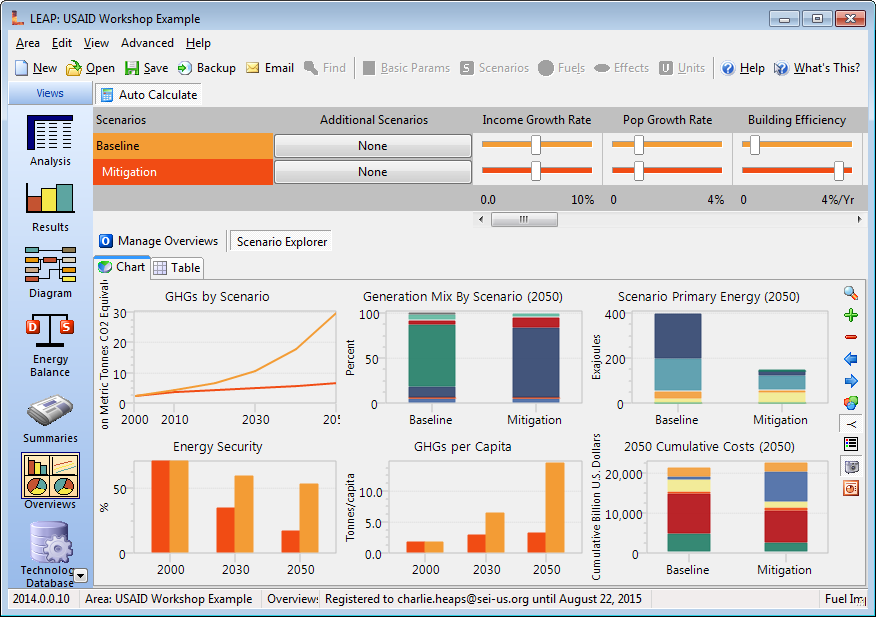
The Overviews View is used to group together multiple "Favorite" charts (originally created earlier in the Results View). With Overviews, you can simultaneously examine different important results, such as costs, environmental impacts, and resource requirements. The Overviews view is only accessible once you have saved one or more favorite charts, and created one or more scenarios. In addition to displaying charts, the data for those charts is also available in table format by clicking on the Table tab.
You can create multiple named Overviews, each of which can display up to 16 different charts. Use the zoom button ( ) to zoom in on a particular chart, by switching to the Results View to display the that chart. Use the Add (
 ) button to add a favorite chart into an Overview or use the Delete (
 ) button to remove a favorite chart, Use the Overview Manager (
 ) to select which favorite charts you want to include in an overview. You can also use the Overview manager to add a new overview and to rename and delete overviews.
The Scenario Explorer is the top panel of the Overviews View. It can be shown or hidden by clicking the Scenario Explorer button on the Overviews toolbar. Each color-coded row of the Scenario Explorer corresponds to a particular scenario, while each column corresponds to a particular Key Parameter. The Scenario Explorer is designed to let you quickly explore the impact that changing Key Parameters has on the results of your scenarios.
You can apply a number of formatting options across all charts shown in the Overview. Click on the Y button to toggle the display of Y axes in the charts. Click the Color Palette ( ) button to select a new color palette for all charts in the Overview. Click the Background Image button (
 ) to toggle the display of any background images included in the Favorite charts and click the PowerPoint button (
 ) to export all of the charts in an Overview to PowerPoint.
When viewing an overview as a table use the toolbar options on the right of the table to adjust the way that numbers are formatted and to adjust the font size and typeface of the table, Other buttons are available to let you print the table ( ) and export it to Excel (
 ).
).