Topic: Error in Creating Load Shape Subscribe | Previous | Next
Suhono Suhono 7/2/2014

1 Like 1990 Views Hi Taylor,
I am trying to create load shape by importing hourly data from Excel. I have load data for 8760 hours. I set up time slice:
Main Slice: 8760 hours
Groups: Whole Year
In the Yearly Shapes, i click Import Hourly Shape. I use the same table format as the sample load shape but change the data with my own. I have placed the Excel file in the same folder of area. When i import the data, error happens and the LEAP program is not responding. Please help me on this..
Question: Why in the "import annualy data...." window, the excel range always filled by "KWh"?
Thanks
Taylor Binnington 7/7/2014


1989 Views Hi Ahmad,
To your question - in the dialog box that appears once you click 'Import hourly Shape' (from the Yearly Shapes window), the Excel Range field is automatically populated by the range names that have been assigned in your running copy of Excel. It sounds like "KWh" is the name of a range in your Excel spreadsheet. If you want to import a different range, follow these instructions to create a named range in Excel, which will then appear after you click 'Import Hourly Shape':
http://office.microsoft.com/en-us/excel-help/define-and-use-names-in-formulas-HA010147120.aspx#BMquickly_name_a_cell_or_range_of_cells
I do want to caution you against setting up time slices for each of the 8760 hours in a year. This can be very taxing for LEAP (and may cause it to hang), and as such I have discouraged it in the past for other users. LEAP is intended to be used as a long-term planning tool, rather than a fully featured electricity system model – asking LEAP to dispatch processes to meet transformation requirements in every hour of every year (in scenarios that are 20 years long, or more) is often an unnecessary level of resolution for a long-term planning exercise.
Hope this helps,
Taylor
Suhono Suhono 7/11/2014
Suhono Suhono 7/19/2014
1900 Views Hi Taylor,
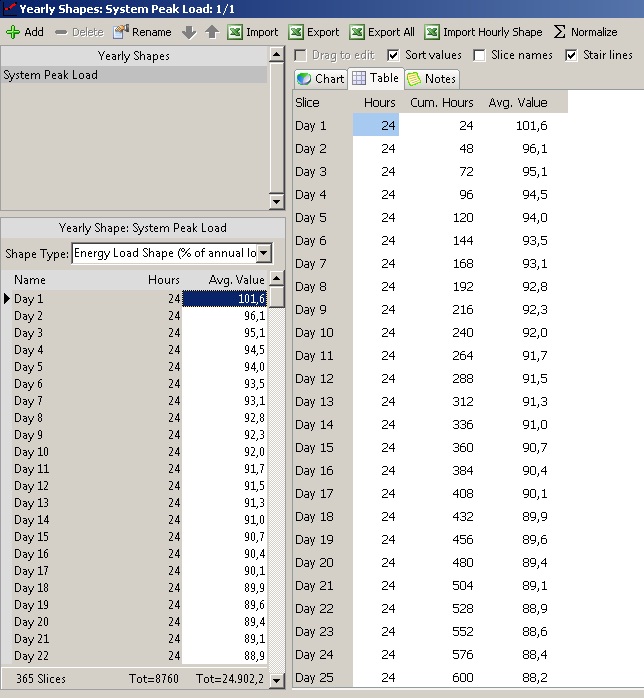
I have devided time slice in 365 days.Then, i imported hourly data in yearly shape successfully. In yearly shape window,
i set Shape type to Energy Load Shape. I confuse why in the Avg. Value column appear value 101,6%? (day 1). In my point of view, max avg. value should be 100%. Is there any wrong with my data?
Thanks
Taylor Binnington 7/30/2014
1896 Views Hi Ahmad,
Can you describe the exact steps that you took to import the data, beginning with clicking 'Import Hourly Shape'?
Please also attach to your post the Excel file that contains the raw data for import.
Thank you,
Taylor
Suhono Suhono 9/2/2014
1803 Views Dear Taylor,
Thank you for your respons. Here is my data. Please find attached file as per your request. Please help me with your suggestions. Thank you
Regards,
Ahmad Suhono
 Peak Load Data 2010.xls [15]
Taylor Binnington 9/3/2014
1802 Views Hi Ahmad,
Thank you for the file. I was able to successfully import the data in your spreadsheet, by selecting the range of 365 x 24 hourly data and assigning it a range name (following the method outlined in a link, provided in an earlier posting). I then clicked 'Import Hourly Shape' from the Yearly Shapes dialog box, and chose the Excel range which I had just named.
Please ensure that you are using the most up-to-date version of LEAP before performing these steps, which incorporates some adjustments to LEAP's time slices.
Hope this helps,
Taylor
Suhono Suhono 10/22/2014
