What's New
Find out what has changed in LEAP, from the most recent releases all the way back to the early days of LEAP. All versions of LEAP are backwards compatible, meaning that any models created in earlier versions can be opened in newer versions.
Download the latest version here.
LEAP 2024
2024.5.0.7: 12/5/2025
Further update to fix a possible "Duplicates Not Allowed" error.
Improved reliability of processing mapping .shp/dbf files in cases where the LEAP area is located under a Dropbox, OneDrive or similar synchronized folder.
2024.5.0.6: 11/20/2025
HSD: Added support for Homogeneous self-dual barrier optimization (HSD) methods when using Gurobi and CPLEX solvers in optimization-based scenarios. HSD provide stronger detection of infeasible or unbounded models and models with numerical trouble. It generally produces more robust, stable and faster calculation of results with ill-conditioned models (models in which small changes in the inputs cause large changes in the solution). However, for well-conditioned models, HSD can be slower than standard methods. HSD is off by default. You can control which methods are used in different scenarios by specifying data at the Optimize and Energy System Optimization variables. See this page for more information on how to switch on HSD. Informal testing suggests that it can be worth switching on HSD for models with large numbers of time slices.
Improved speed of writing NEMO input files.
Improved speed of looking up inherited expressions across scenarios/regions.
Fixed "$required..." error messages.
2024.5.0.4: 11/15/2025
Fixed "Duplicates Not Allowed" error when opening some older areas.
Fixed "ParentBranchID must have a value" error when opening some older areas.
Fixed language translations not working, due to some background changes in Google API.
Fixed problem with Sankey diagram not showing non-English language characters in labels.
Fixed error when selecting items from certain dimensions in Results view.
Improved display of resource constraints in Analysis view: now allows selection of unit and also allows editing of certain resource variables in Current Accounts that previously were hidden.
2024.5.0.3: 11/4/2025
Fixed error evaluating default expression for the "Simulation Type" Transmission variable. This only occurred on PCs with non-English language regional settings. Defaults were not being stored as UNICODE strings.
2024.5.0.2: 11/2/2025
Allowed referencing of base year value of activity level variables in functions even if variable hidden due to use of useful energy method.
Added ability to reference auxiliary fuel use methods and effect methods via the Branch API object.
Fixed errors when adding tags via the tag toolbar.
Fixed error renaming top level (area) branch.
Fixed incorrect reading of multi-region demand results from NEMO back into LEAP.
Fixed problem in registerleap.bat batch file.
2024.5.0.1: 10/27/2025
Fixed glitches related to checking of unit names and branch IDs introduced in last version. Apologies!
2024.5.0.0: 10/27/2025
Emission Factors: Re-enabled the option to add IPCC Tier 1 emission factors to all technology/fuel branches and improved its UI. This option was hidden in earlier versions. You can access it from the Tree popup menu. Use this feature with caution and be sure to carefully review all emission factors added. Also added an option under the Tree menu/popup to delete all effect branches. Use with caution!
New version of IBC: The Impact Benefits Calculator: IBC now includes the relative risk functions from the 2019 Global Burden of Disease (GBD) in addition to the previous GBD 2010 and GBD 2015 functions. The new version of IBC also includes Rest of World emissions scenarios from version 6 of the IIASA ECLIPSE scenarios (in addition to the previous version 5 scenarios). The Settings: IBC screen has been updated to reflect these new options with a new selection box for choosing the "Rest of World Emissions". The LEAP API has also been updated to allow you to vary these options among scenarios for sensitivity analysis purposes. See this page for more details on how to do this. For now, the indoor air pollution impacts calculations only support GBD 2010 and GBD 2015.
Improved Handling of "Unlimited" values: Improved plotting of charts and tables showing maximum constraints in Analysis View. By default, any constraints marked as "unlimited" are now hidden. A check box above the chart lets you override this if you want to show these series.
Renewable Targets: The Renewable Target variable has been moved from the Load Shapes branches and can now be specified at each Transformation module.
Exporting Energy Balances: The ability to export all energy balances (across multiple years) has been restored to the Energy Balance View. Clicking the Excel button in the Energy Balance View now lists two export options: "One" and "All".
Bug fix: LEAP was not passing Transformation auxiliary fuel and optimized demand device emission factors to NEMO.
Bug fix: Reserve margins were not reliably being written to NEMO. NEMO specifies reserve margins by fuel, whereas in LEAP they can be specified at different Transformation modules. The code that identifies which module is associated with which NEMO fuel has been improved to resolve this issue.
Bug fix: LEAP was incorrectly reporting net generation from storage processes in time slices where there is both input to and production from a storage process. The results generated in NEMO were calculating OK, but LEAP was reading them back incorrectly. This situation is quite rare but it could lead to underreporting of generation from storage.
Bug fix: Hiding/showing load shape branches caused all system load shape expressions to be erased.
Bug fix: Error when using Branch/Variable wizard from Key Assumption branches.
Bug fix: Screen not updating when adding a tree branch via API.
Bug fix: Error when adding an effect to Transformation outputs via API.
Bug fix: Scaling factors for demand technology share constraints were not being properly passed to NEMO.
Bug fix: Scaling factors and units for auxiliary fuel use were not being properly passed to NEMO.
Bug fix: Charts & tables for externality costs and annual emission constraints were not properly reflecting specified scaling and units.
Bug fix: In the Scenario Expressions screen, the list of branches was sometimes not being updated until keys were pressed.
Bug fix: When referencing emissions results in expressions, LEAP was not properly handling effects whose names contained parentheses "()". In addition the two default methane effect abbreviations have been updated to be CH4 and CH4FP (for fugitive and process).
Bug fix: LEAP was incorrectly capitalizing effect names in result filters so that CH4 became Ch4, CO2 became Co2, N2O became N2o, etc.
Bug fix: In dark themes, components showing trees with check boxes (e.g. in the Scenario manager screen) were incorrectly drawing with a small white rectangle to the right of each check box in the tree. Annoying! Now fixed.
Bug fix: Error when plotting charts with a logarithmic y axis if any values were negative.
Bug fix: Potential for an error on LEAP shutdown if the shutdown was instigated while LEAP was still attempting to connect to the LEAP server (e.g., to check for an update).
Bug fix: Units for minimum imports not being properly applied.
Bug fix: Analysis View charts and tables sometimes not being updated after resource data edited.
Bug fix: In Analysis View, charts and tables showing Total Final Energy Consumption were not properly respecting selected units.
Made startup more robust: It now guards against the possibility that a particular theme may generate errors on some PCs. Now, if LEAP closes down improperly, the theme will be set back to the default Windows theme on next startup.
Updated the LEAP error reporting system to make it more robust. It now does not show error dialogs using themes.
Refactoring of code to make data structures more robust using more modern memory management techniques.
Added additional internal data consistency checks (e.g. to ensure that key fields are not null and to check for duplicate named units, effects, and fuels).
Other minor bug fixes and UI improvements including improved dialog boxes with more instructive text.
Updated help reflecting above changes.
Deprecation: In 2026, we will stop producing the 32-bit version of LEAP. We will also remove the LEAP-WEAP linkage features in LEAP (which only work in the 32-bit version due to WEAP being a 32-bit only app). While we have seen many users integrate LEAP and WEAP for energy-water nexus modeling, we see that very few are doing this using the built-in WEAP-LEAP linkage feature: likely because of its limitations w.r.t. requiring one-to-one mapping of time slices in LEAP and WEAP. If you need to use these features you will be able to do so by continuing to use an older version of LEAP. Please contact us if you have any questions or concerns.
2024.4.0.15: 8/21/2025
Now properly catches and handles the situation where a load shape is improperly defined with no data (every slice equal to zero).
Added two new constraint variables for demand optimization: Maximum Availability (default 100%) and Minimum Utilization (default 0%). The latter can be particularly useful when set to 100%, if you want to assume that once a device is purchased it must always be used. These variables work just like the same named Transformation variables.
2024.4.0.14: 8/19/2025
Better handling of sub-national data sets in LCDS queries.
Bug fix: fixes error due to web browser cached data colliding when accessing help or the Sankey diagram across multiple tabs in a LEAP instance.
2024.4.0.12: 8/19/2025
Bug fix: Fixed range error in Results view in some areas.
Integrated Help: By default, help pages are now shown integrated within each view (where possible). For supporting screens like the fuels, scenarios, or setup screen, help pages still display in a separate browser window. If you prefer help to always appears in a browser window, uncheck the "Integrated Help" option on the Help menu.
2024.4.0.11: 8/15/2025
Fixed issue stopping some charts showing in stacked bar format.
Added one additional composite dimension for "Scenarios & Effects".
2024.4.0.9: 8/14/2025
Performance Improvements: The last version of LEAP was unnecessarily clearing cached data structures, which caused a slow down in calculations. That problem is now fixed and additional code has also been refactored with the result that this new version of LEAP has significantly faster calculations. For some large non-optimization-based models, calculation times are reduced to a third or less of their previous duration (vs. 2024.4.0.2).
Result Labels: Further improvements to the labels used in charts and tables. Some dimensions of results in LEAP have both a long name and an abbreviation (scenarios, regions, effects). In addition, time slices can be represented both by their names and by the cumulative number of hours in each time slice. LEAP now lets you choose how to label these dimensions. You can choose to show long names, abbreviations (hours for time slices) or both. When showing both, labels display the long name followed by the abbreviation enclosed in parentheses. For example, for a scenario you will see something like this: "Baseline (BAU)"; for an effect: "Carbon Dioxide (CO2)", or for a region "Egypt (EGY)". The labels button in the Results view side toolbar has also been reorganized to improve usability. Look for an option named "Label Format" reached from this button, with choices "Long Names", "Short Names", and "Both". The label button also provides access to label rotation and other label formatting options.
Improved Diagnostics: The Results View diagnostics table now has filters to show only selected scenarios, regions, and years, and all diagnostic messages can now also be exported to Excel.
Transmission Maps: Fixed missing map markers in the Transmission Nodes and Transmission Lines screens.
Improved handling of environmental effects and GWP results. Choosing "Selected effects" sometimes did not work.
Fixed error message during attempts to connect with LCDS: the LEAP cloud data server. The error occurred in situations where LEAP was running in evaluation mode (with no licensed user).
Improved installation process for greater reliability.
2024.4.0.8: 8/8/2025
Demand Optimization: Updates to how LEAP writes optimized demand results read from NEMO. Now, one technology is always saved using the "Remainder(100)" expression. This guards against rare occasions when, due to rounding, NEMO records no production results even though useful energy demands are non-zero.
LCDS: Updated how LEAP interacts with the newly updated LCDS (LEAP Cloud Data Server). Connections to LCDS are now more robust and better support logging of activity. LCDS now returns queries significantly faster (some that previously took 10 seconds now take less than a second). Country data in LEAP has also been updated to reflect newer country names and we have added some missing small island developing states. Apologies that LCDS was unavailable for some time this week as we updated it and moved it to our new server.
Bug Fix: Fixes a bug in evaluating expressions using Interp and other Time-Series functions that themselves contain Growth functions like this: Interp(2015, Growth(1%), 2020, Growth(3%), 2040, 5%). Following a recent update, LEAP was incorrectly applying the growth rate AFTER the one it was supposed to use in each period. In spite of this fix, we strongly recommend that you do not write expressions like this since they are fundamentally ambiguous and thus detract from transparency. For example, with that expression you might expect a growth rate of 3% in every year from 2020 to 2039. However, the Interp function implies that there will be a linear trend between the listed years (2015, 2020, 2040). In fact, this latter interpretation is what LEAP actually does. In general, we strongly recommend you do not embed growth functions within Time Series functions. We suggest you use the Growth function on its own instead. It can take multiple growth rates applied in different periods like this: Growth(3%, 2020, 4%, 2030, 5%).
2024.4.0.6: 8/4/2025
This release makes demand-side optimization more robust, improves the plugin architecture and the "import from other area" feature, and also makes behind-the-scenes changes to remove all use of FTP.
PlugIns/Insert Branches From Other Area: Various bug fixes and UI improvements to Plugins and the "Insert Branches From Other Area" menu option. They now support inserting Key Assumptions and Non Energy Branches, and also better handle imported expressions that refer to branches that are not within the group of branches being imported or plugged in. They also have improved handling of User Variables and better support for importing multiple groups of branches from plugins. An option to "Insert Plugin from Folder" has been added to the tree popup menu to highlight the use of LEAP&s new Plugin architecture.
Demand-side optimization in full energy system optimization scenarios: Previous versions did not support having different settings for "optimize devices" in different regions. Also, errors could occur referencing demand optimization variables if the "optimize devices" variable was set differently in different scenarios or different regions. There is now a new branch property named "Devices Can Be Optimized" that you must first set at useful energy demand category branches to enable whether useful demand can be optimized. Once this set, in optimized scenarios you will see all of the demand optimization variables in Analysis View, and you can now set different useful demands to be optimized or not optimized in different scenarios and regions.
Full Energy System Optimization: Added checking of minimum/maximum constraints before LEAP runs NEMO's optimization calculations. This should reduce the chances of infeasible optimization calculations with data errors being reported much more quickly (i.e. less waiting for lengthy optimization calculations to eventually report an infeasibility). Errors are reported in the LEAP IDE, which also helps you to quickly fix any problems. The new checks test minimum/maximum process capacity, demand devices additions, process outputs, primary production, and resource imports.
Projecting Forward Historical Growth: Improved the HistoricalGrowth function to allow it to now calculate growth rates over periods extending beyond the Current Accounts period. You can thus specify time series values in Current accounts going beyond the first scenario year and then use the GrowthFromYear function to apply growth rates based on the historical period that apply from some year after the First Scenario Year onwards. For example, imagine your base year is 2000, first scenario year is 2020, and end year is 2050. You can now specify data in Current Accounts for a longer period (say 2000-2024) using (say) an Interp function. Then, in your scenario you can have that data grow at the historical rate by writing: GrowthFromYear(2025, HistoricalGrowth(2000, 2024)). The scenario will get its values from those specified in Current Accounts for the years 2000-2024, even though the first scenario year is 2020. This can be useful when you have to choose a single common First Scenario year but different data sources stretch over different time periods.
Navigation: Added a new top level menu labeled "Navigate" that gives access to options for navigating to the previous or next branch, variable, scenario and region. Most users will probably prefer to use shortcut keys for these actions (Next Branch=Alt+B, Prev Branch=Alt+Shift+B, Next Variable=Alt+V, Prev Variable=Alt+Shift+V, Next Scenario=Alt+S, Prev Scenario=Alt+Shift+S, Next Region=Alt+R, Prev Region=Alt+Shift+R). The new menu option was added primarily to remind users of these useful shortcut keys.
Removed all use of FTP: For improved security, more robust connectivity, and easier IT configuration, all use of FTP for file transfers has been replaced with HTTP protocols.
Fixed a bug in the handling of energy exports in full energy system optimization scenarios. The error could cause current accounts period results to differ between scenarios. CA results should be the same across all scenarios (with the exception of sensitivity scenarios).
Fixed recently introduced problem with evaluation of Linear, Exponential and Logistic Forecasting functions (LinForecast, ExpForecast, LogisticForecast).
Fixed error viewing multi regional energy balances if the previously viewed region was then removed from calculations.
Various bug fixes and UI improvements in the Time Series Wizard resulting in improved plotting of preview charts and proper rounding of decimal values when the wizard submits a function back to Analysis view.
Now runs NEMO in quiet mode with only important progress information displayed on screen during calculations.
Fixed a problem in Transformation simulation calculations where endogenous capacity would not be added in a module if the planning reserve margin was set to zero and the module had no load shape data. With no load shape, LEAP could not translate the energy requirements into a peak load requirement (the basis for measuring planning reserve margins). Now, when there is no explicitly specified load shape, LEAP assumes a flat load shape.
Updated all sample LEAP areas to ensure they are operational with newest version of LEAP.
Various bug fixes to improve compatibility with older LEAP areas. Certain forms of variable references used in older data sets caused problems in the latest version of LEAP. These are now supported again.
2024.4.0.2: 7/24/2025
This release is focused primarily on improved results visualization with new "Composite Dimensions" and better chart display and interaction capabilities.
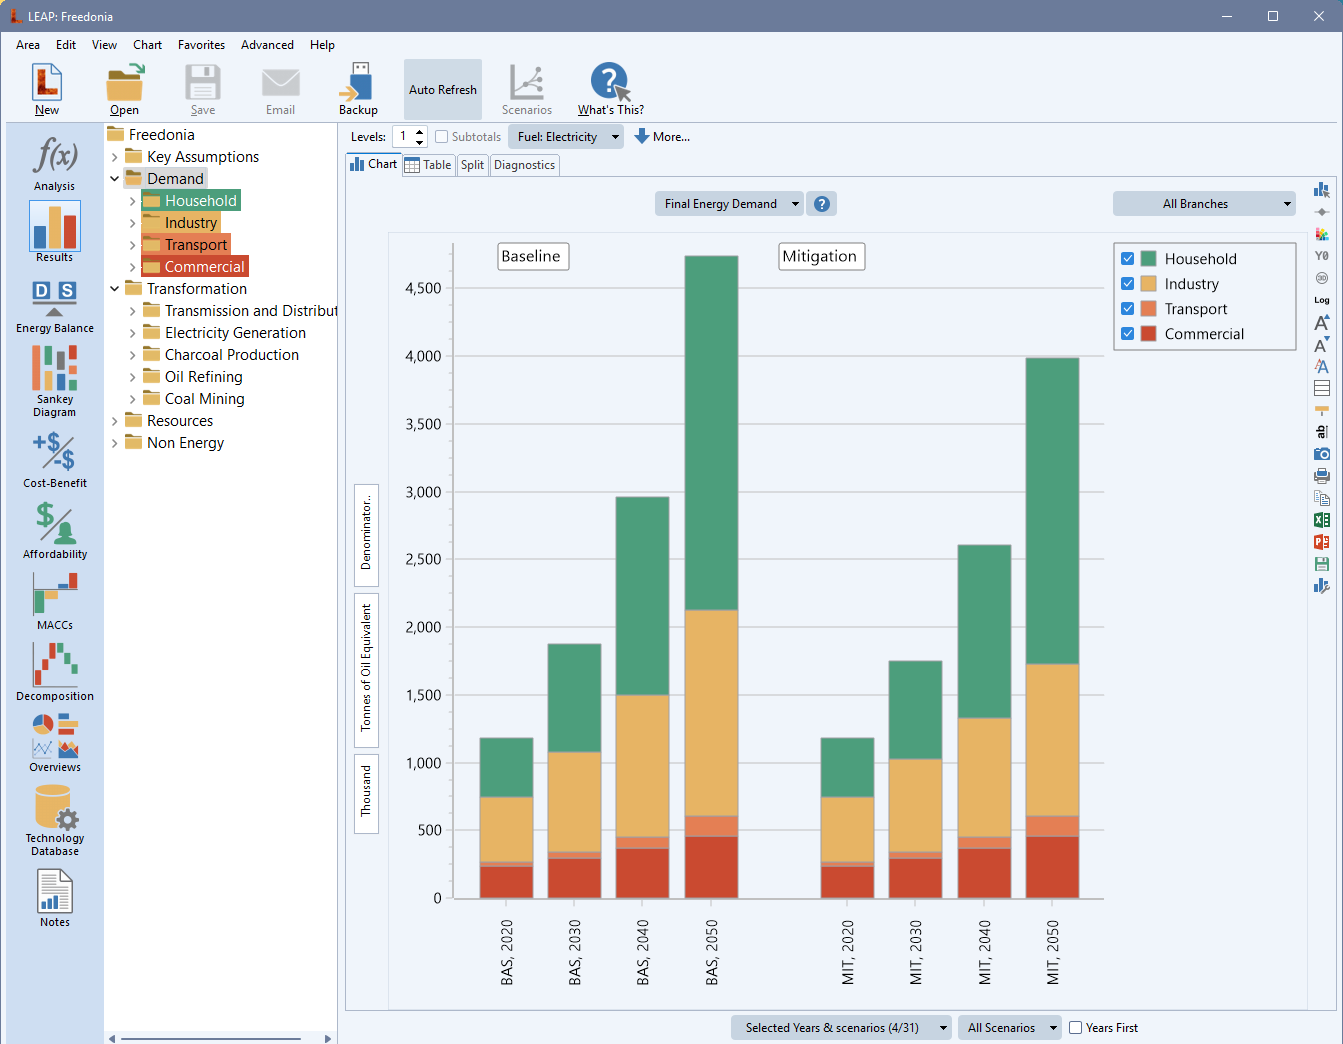
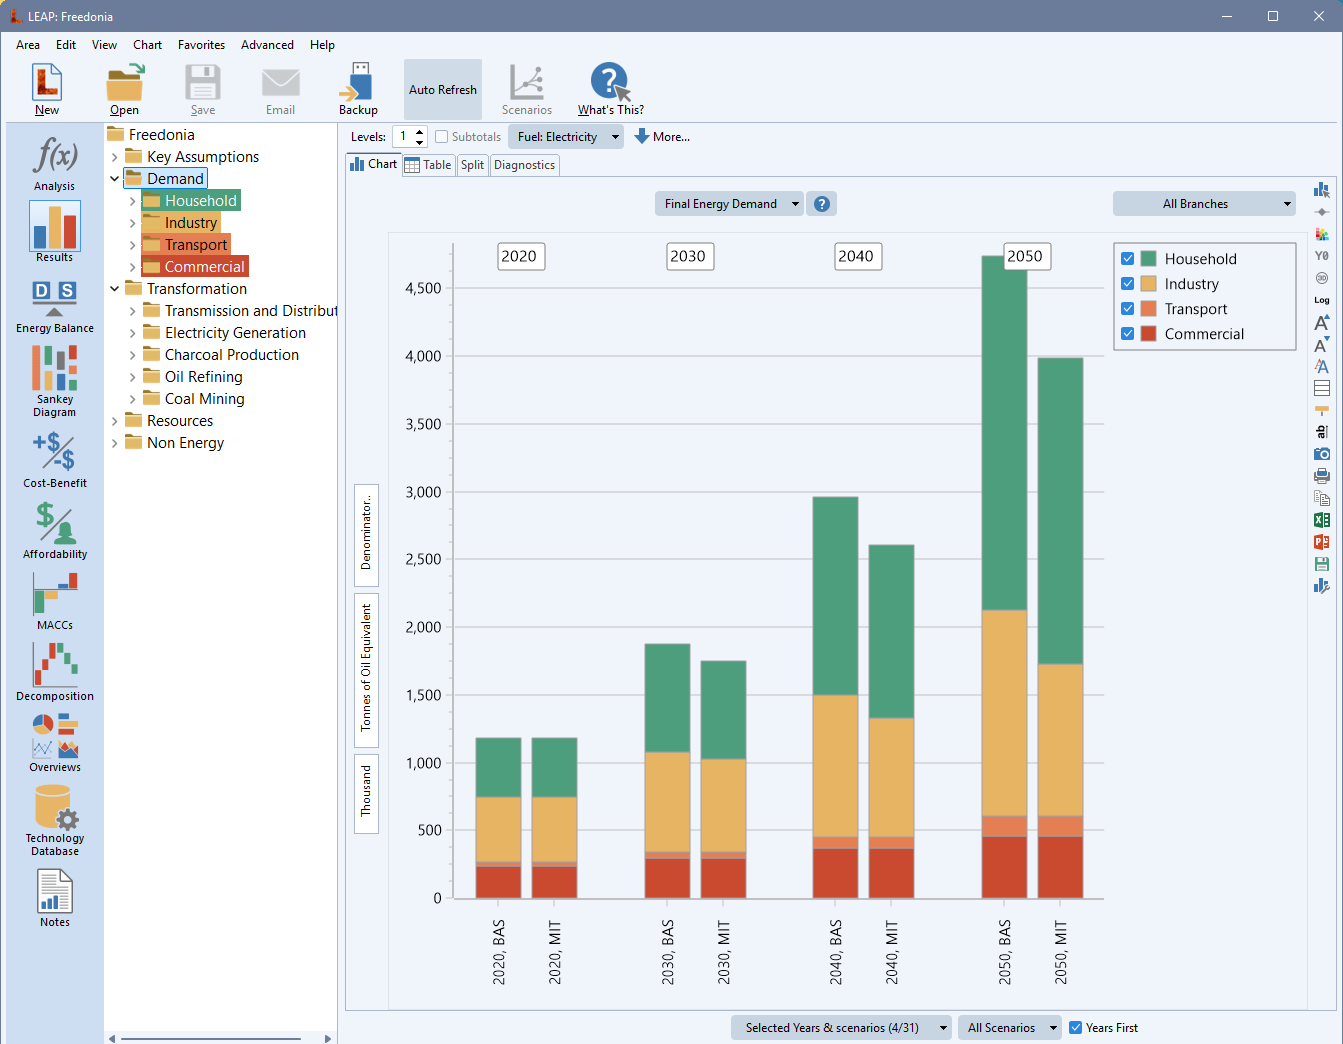
Composite Dimensions: We have expanded the concept of "Composite Dimensions" in Results View to allow many more combinations of dimensions of results to be plotted on the X axis of charts - making it possible to create a greater range of chart types. This is particularly useful when used to create multiple side-by-side charts all sharing the same Y axis. For example, you can now create charts that compare results across selected years, scenarios or regions. The list of composite dimensions available depends on the type of results being plotted including: Scenarios & Time Slices, Scenarios & Branches, Scenarios & Fuels, Scenarios & Regions, Years & Time Slices, Years & Scenarios, Years & Branches, Year & Regions, Years & Fuels, Years & Effects, and Regions & Time Slices.
Composite dimensions can be selected via the button below the X axis in Results View. Look for the sub menu labeled "Composite Dimensions" for options. Once a composite dimension is selected an additional button will appear below the X axis from which you can choose all or selected elements of the second dimension. A checkbox next to that lets you select the order in which the dimensions are plotted. For example, when selecting Years & Scenarios, you can plot separate charts for each scenario with each chart showing years, or you can plot one chart for each year comparing values across scenarios. Note that you can also choose to display all or selected items for each dimension.
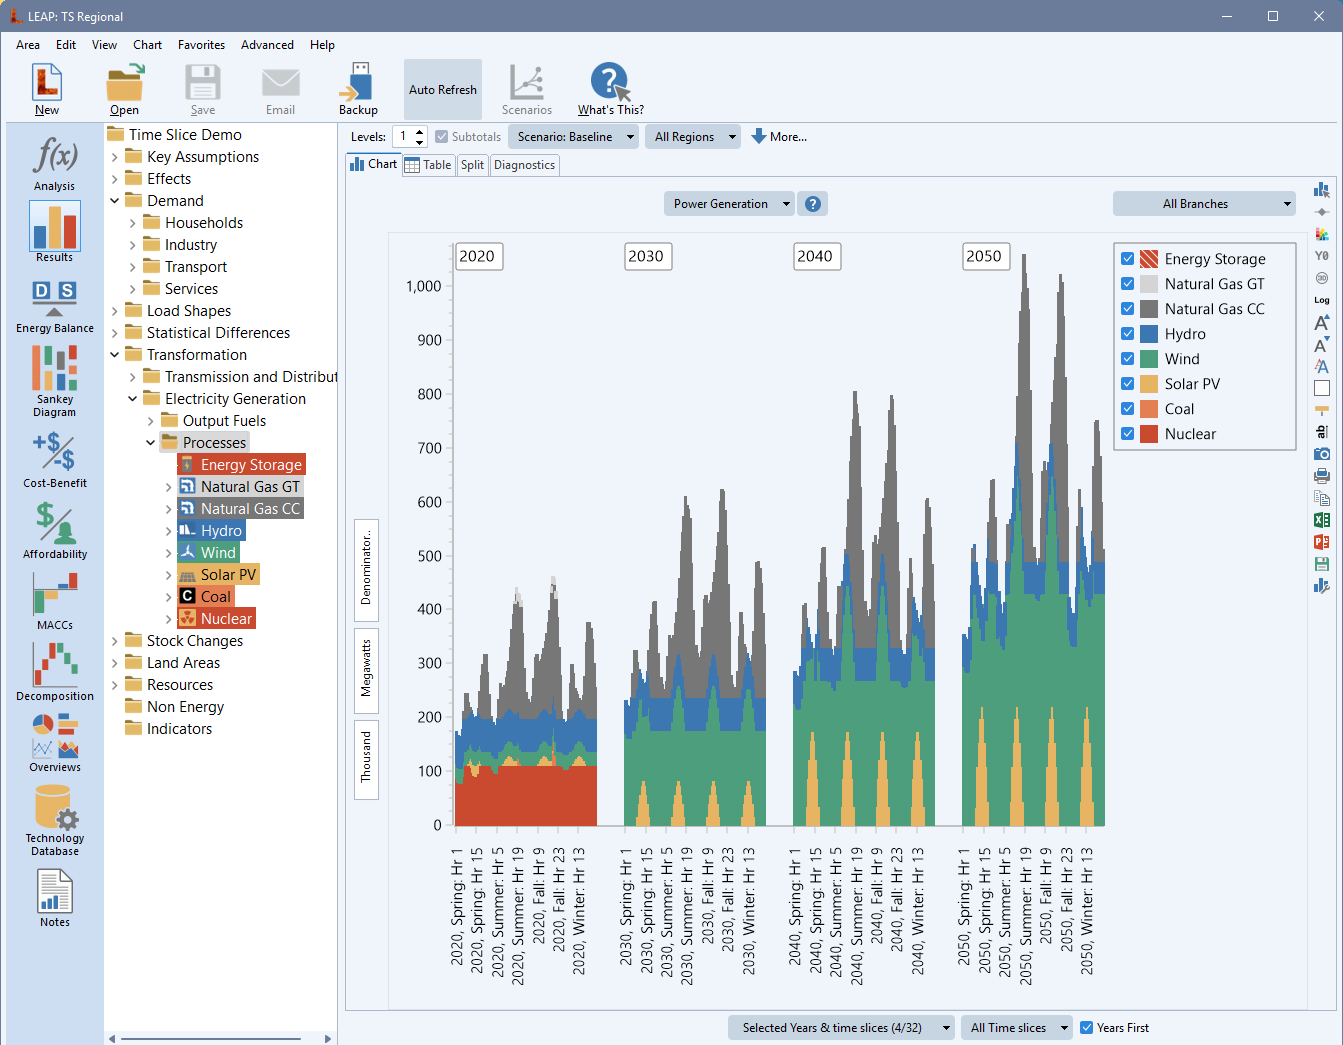
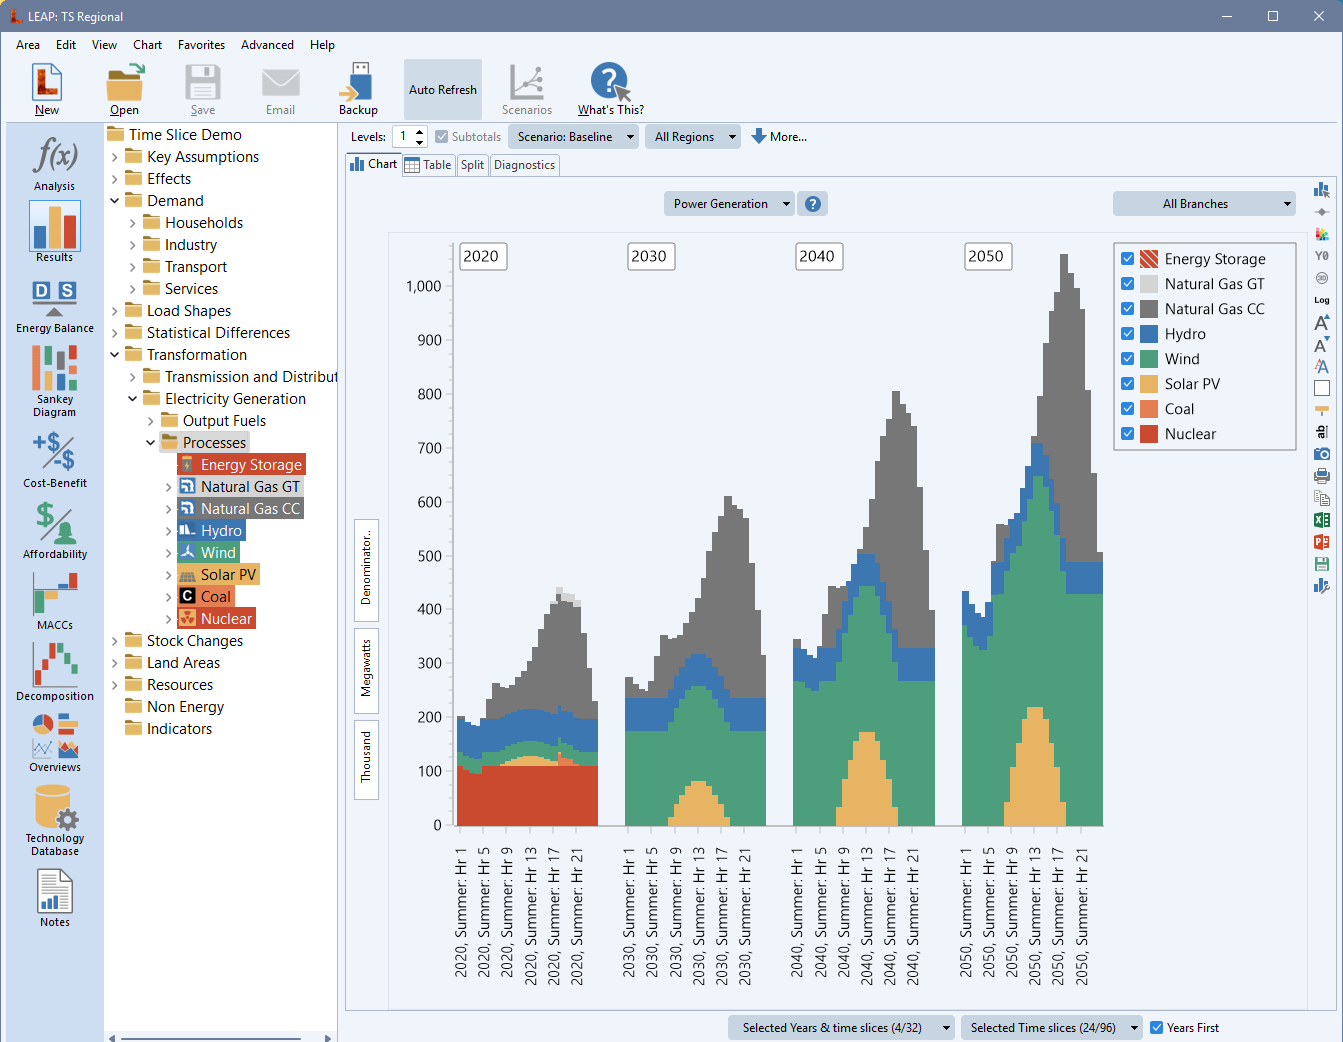
When working with time slices, new buttons in the "selected" dialog let you filter time slices to show the slices for a particular season, day type, or time of day, with the choices depending on how you have configured your time slices. Similarly, when working with fuels you can quickly select fuels from a particular fuel group (e.g. all oil products).
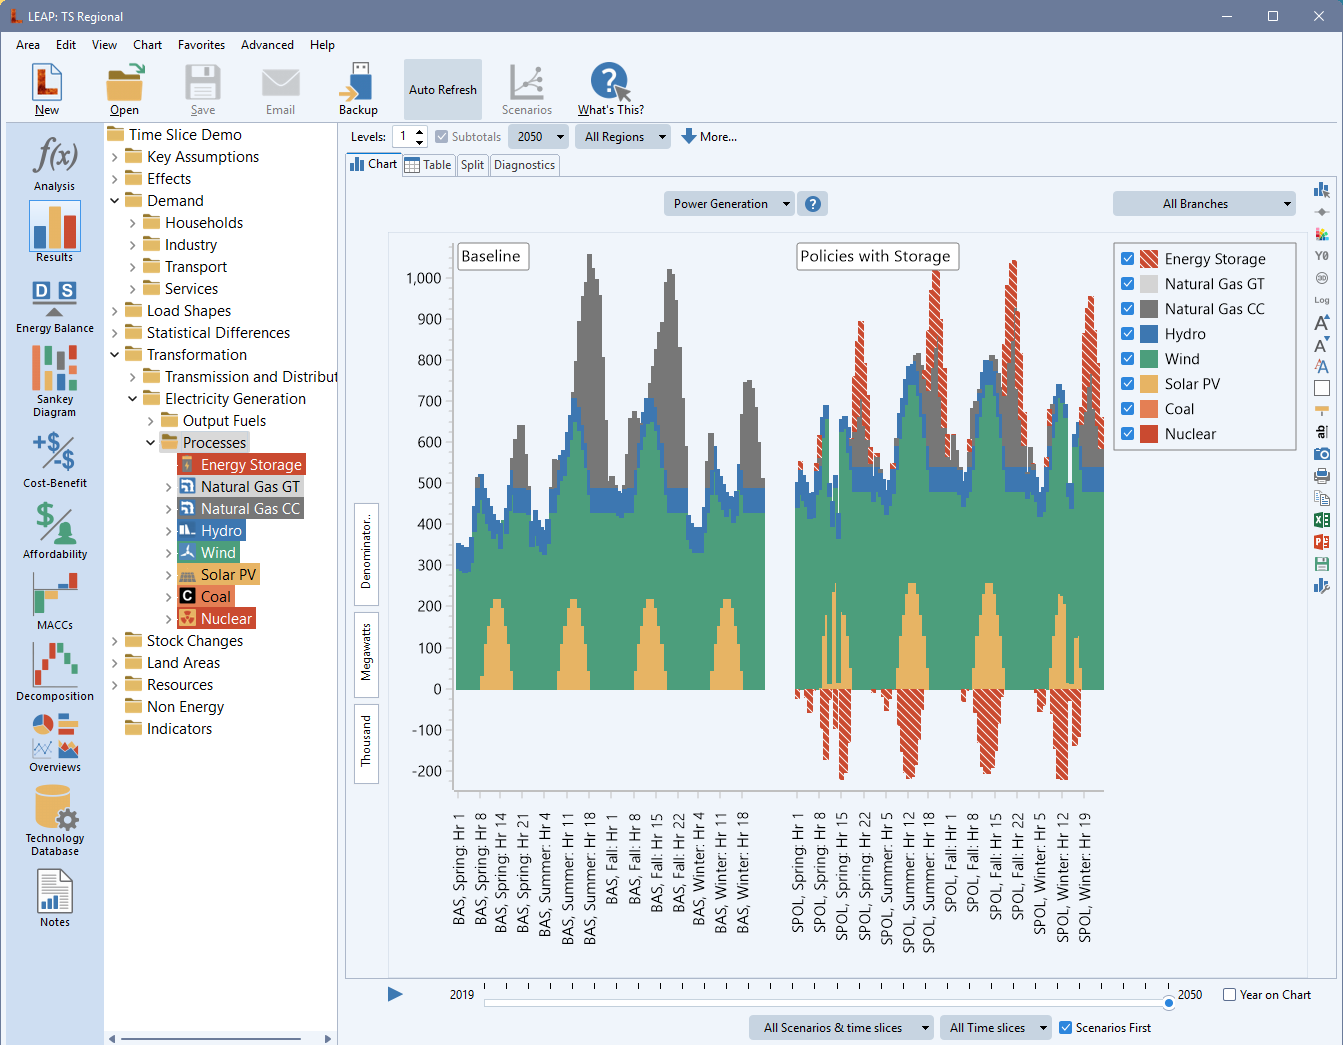
A few examples of charts with composite dimensions are shown below, including one showing results for time-sliced power production animated by year including the energy consumed or produced in different time slices by storage technologies.

Axis Labels: When showing composite dimensions on a chart X axis, you can now choose various options for formatting labels. By default, the names of the items in the first dimension are now shown as labels across the top of the chart, with the items from the second dimension shown as the chart's X axis labels. If you prefer, you can show both the first and second dimension names entirely on the X axis separated by a colon. New label formatting options help properly display X axis labels when there are many items or when labels are long. In particular you can now choose to wrap long labels, to show alternating low & high labels when the label rotation is zero degrees (to make more room for more labels) and you can allow the chart to display labels even if they are likely to overlap each other. Normally, we recommend hiding overlapping labels, but this option can be useful when labels are very close together or when using 45 degree rotation of labels, since the overlap-prevention algorithm in LEAP can sometimes be inaccurate.
General Improvements to Charts (1): LEAP now renders the text of chart labels in higher quality, making it easier to read axes and other labels.
General Improvements to Charts (2): Chart interactivity has been improved. After hovering over the Results View chart legend to highlight a series, the series colors and shading were not being reset back to their correct values. The display of pie charts and column charts has also been improved. When highlighting pie chart items in the chart legend, the corresponding segments in the pie charts will temporarily be exploded.
Improved Printing and Exporting of Charts: Extra chart labels such as the display of the year on some charts or the labels on composite dimension charts now properly size and align when printing and exporting, and all export formats now work correctly. Exporting to SVG files is also now supported. The file formats supported are: BMP, PNG, GIF, JPG, SVG, PDF, EMF, WMF, PPTX, DOCX, XLSX, CSV, TXT, and HTML. You can now also copy charts to the clipboard as either bitmap or enhanced metafile (vector) format.
UI fix: When working offline and help is not available, a warning dialog was appearing often. This annoying warning can now be stopped using a "Don't show again checkbox".
UI fix: Similarly, there was no way to suppress the warnings about "Current Selection Contains No Results" in Results View. A "Don't show again checkbox" has also been added to address this. The dialog has also been enhanced to support composite dimensions.
Bug fix: An error could occur when editing or deleting fuel groups or region groups.
Bug fix: Further improved algorithm for saving reserve margin data to NEMO. Reserve margins for some modules were not being properly saved to NEMO.
2024.3.0.2: 7/3/2025
Bug fix: Tree not updated when Transformation process renamed via process properties dialog.
Bug fix: Data function improperly extrapolates last specified data value.
Bug fix: Time-series wizard Next button not enabled after data source selected.
2024.3.0.1: 7/1/2025
This release is a significant update with improved energy demand optimization modeling, new tools to support debugging of LEAP areas, better error handling, a more powerful Find tool, usability improvements to the LEAP IDE, and a large number of bug fixes. It is recommended for all users, especially if you have experienced problems with using older LEAP areas in recent versions of LEAP.
Demand Optimization: Optimization of demands as part of full energy system optimization calculations has been improved. A new variable named Exogenous Devices specifies the number of devices added exogenously in each scenario (i.e. regardless of the optimal value). This will most commonly be used to specify devices that exist at the start of a scenario period. You can now also specify various constraints on optimized demand technologies including Minimum and Maximum Devices, and Minimum and Maximum Device Additions (per year). LEAP no longer uses the variable Devices per Activity. Instead, numbers of devices are calculated internally during energy system optimization calculations based on the overall level of energy demand, the load shape, and the unit capacity of each device. The new result variable "Demand Devices" shows the total number of devices in each year at each demand branch. Costs of optimized demand branches were not properly being reported in the Cost-Benefit summary view. LEAP now properly shows the costs of optimized demand branches: separately tracking capital costs, fixed O&M costs, and variable O&M costs. It can also show non-annualized investment (capital) costs. This update also fixes various calculation problems that were affecting demand-side optimization calculations in previous versions of LEAP.
IPCC GWP factors: A recent update to LEAP added GWP factors from the IPCC sixth assessment report. Using the IPCC GWP values variable defined at the top level area branch, you can specify different GWP factors for different scenarios (as a way of exploring how the GWP factors affect results). Extra checks now ensure that invalid values for this variable cannot be entered (which could cause GWP emission results to be incorrectly marked as zero). You can now also use the orange "E" button attached to expressions to select among the preset IPCC values for different assessment reports. In most cases we suggest leaving this value at its default (zero). Doing so will cause all scenarios to use whatever GWP values are specified in the General: Effects screen.
Error Handling: The LEAP IDE has redesigned error handling. If an expression refers to another branch/variable that itself contains an error, LEAP will now report the original source of the problem and then place the cursor at that location: making it easier to identify and fix problems in your model. The error reporting dialog has also been simplified to make it easier to quickly interpret error messages.
Error Handling in Scripts: Up until now, when running a script to automate LEAP, if the script accessed LEAP branches or variables that themselves contained errors then the script error handler would only be able to report an error message and the line in the script where the error occurred. It could not report detailed information about the branch, variable, scenario and region in LEAP that originally caused the error. This could make it hard to debug scripts. If a scripting error is caused by an error in a LEAP model, the error handler now reports the location of the errors in both the script and in the automated LEAP model.
Tree Editing: When editing a branch name in the main data tree, LEAP now properly handles pasting of text and the small edit box overlaying the tree now also has its own popup menu showing standard text editing actions (cut, copy, paste, select all, delete, undo).
Find: To help with model debugging, the Find dialog (F3) can now highlight expression errors and you can now choose to filter results to show only those branches and variables with errors. In addition, it can now also be used to search the LEAP web site and user manual. Various other UI improvements and bug fixes make the Find tool faster and easier to use.
Expression Parsing: Recent versions of LEAP could not properly evaluate time-series functions (Interp, Step, etc.) if they contained parameters specified using Growth, GrowthAs or PrevYearValue functions. This caused errors in some LEAP models created in earlier version of LEAP. This new version restores support for these functions when used within time-series functions.
Offline Help: LEAP can now work with an offline copy of help. You can download a copy of the help system here. Unzip this to any folder of your choosing. If you want LEAP to use this offline copy, create a text file named help.ini in the program files\LEAP folder. Edit the contents of the help.ini so it contains a single line of text containing the root folder of the path where you unzipped the leaphelp.zip file. For most use cases, we suggest using LEAP with its existing online help system since that system is regularly updated. However, offline help may be useful if you are using LEAP in places without an internet connection.
New Bug Reporting System: We have switched to the Bugzilla bug reporting/feature request tracking system. The new version of LEAP now supports submitting error reports into that new system. It also now optionally allows you to automatically upload your LEAP area to the bug reporting system after a crash.
Efficiency Functions: Added new functions to make it more convenient to specify efficiency values by converting from common alternative definitions of efficiency. The new functions are EER, IPLV, HeatRatekJKWh, and HeatRateBTUKWh. The functions return percentage efficiency values based on the parameters provided. For example, specifying EER(12) returns an efficiency of 351.69%, while specifying HeatRateBTUkWh(6500) returns an efficiency of 52.53%. See the help file for further explanation and documentation of these functions. If you want efficiency to improve over time, you can combine these functions with an Interp function like this: HeatRateBTUkWh(Interp(2020, 9500, 2030, 6500)).
Bug fix: Energy production calculated in NEMO in energy system optimization calculations wasn't being fully reported in LEAP results in cases where there were no upstream requirements for a module's output fuels.
Bug fix: Discounted costs in MACC curves were being incorrectly calculated when the monetary base year was set to be after the base year. Discounted costs in all reports were also being incorrectly calculated in years before the Monetary Base Year. Also, MACC curves were not properly distinguishing between capital costs and other costs, which are discounted differently in LEAP. Discounted capital costs are accounted for at the end of each year, while other discounted costs are accounted for in the middle of each year. This was causing subtle differences in the NPVs of partial MACCs versus LEAP's cost-benefit summary reports.
Bug fix: Externality values were not being applied to emissions of pollutants from non-energy sector branches.
Bug fix: When importing expressions from Excel, LEAP was incorrectly handling expressions made up of simple numeric operations (e.g. 2+2 or 10*3). These could cause an error during the import process.
Bug fix: Fixed confused reporting of errors in stock profiles and survival profiles. LEAP sometimes confused the two types of profiles and failed to place the LEAP IDE back at the correct branch and variable where the error occurred. Related error messages also improved.
Bug fix: Error when adding a new unit in General: Units screen.
Better checking and handling of module and process visibility in multi-region models. In full energy system optimization-based scenarios, Transformation modules with no capacity data must be either all visible or all hidden across all calculated regions. LEAP now checks for this during calculations and if an issue is found the IDE will generate an error and alert you to fix the problem. Problems may also arise if visibility varies across other modules that do have capacity data. LEAP creates a warning diagnostic message (but not an error) if it detects visibility varying across regions in these modules.
Bug fix: When specifying demand side optimization in energy system optimization calculations, LEAP was incorrectly adding default (zero cost) technologies to NEMO for the indigenous production and imports of useful demands: thus preventing those demands from being met by their actual technologies.
Bug fix: Reserve margin values in LEAP could be incorrectly passed to NEMO in energy system optimization scenarios. Specifically, the reserve margins applied to the output fuel of a module could also be applied to other modules producing the inputs to that first module. This could lead to calculations being infeasible.
Bug fix: Pasting text into an expression to replace other highlighted text was not working properly. Pasted text was incorrectly offset by one character.
Bug fix: Pasting into an expression a reference to a variable with units in square brackets sometimes led to zero values being calculated if the unit was unrecognized.
Bug fix: After changing the Energy System Optimization variable at the Area branch or the Optimize variable at a module branch, the list of variables displayed in Analysis View was not immediately being updated.
High DPI Support: Updated various visual components (tabs, splitter bars, view bar) with better support for high definition screens.
Bug Fix: In multi-region scenarios with one or more regions disabled, LEAP was not properly ignoring transmission lines that began or ended in disabled regions. Data for these lines was still being written to NEMO, causing its calculations to fail.
The LEAP About Screen and other LEAP functions now properly report when LEAP is installed within Windows 11 (previous versions reported Windows 11 as Windows 10). LEAP now also reports additional details such as the build number and Windows architecture.
Updated units with more precise definition of BTUs, Therms, mmBTUs, and Quads units based on 1 MMBTU = 1.05505585262 GJ.
Bug fix: Exporting a LEAP model to Excel sometimes exported hidden branches and variables, which could later cause display problems if that data was edited and then reimported back into LEAP.
Help system updated to reflect above changes.
2024.2.0.10: 4/22/2025
Fixed problem with calculations of multiple scenarios not properly completing if "Save after each scenario calculated" is checked in Settings.
2024.2.0.9: 4/21/2025
Fixed handling of systems in optimization scenarios in which the fuel "Non Energy" is used as an input to a process.
Fixed handling of sales variable scaling factors in stock turnover calculations (was incorrectly applying the stock variable scaling factor).
Further fix to handling of dialog boxes in certain color themes.
2024.2.0.8: 4/17/2025
Various fixes related to language translations.
2024.2.0.7: 4/16/2025
Checks to prevent invalid IPCC assessment report GWP values being specified.
Fixed handling of errors in certain file management dialog boxes when using the Sky Blue theme.
Fixed error during LEAP.Refresh API call (e.g., affects Asiana data set calculations).
2024.2.0.6: 4/13/2025
Fixed Expression builder could be incorrectly set to be read only.
2024.2.0.5: 4/11/2025
Fixed tree Add button could be incorrectly disabled after an area is saved.
2024.2.0.4: 4/8/2025
Support for limited foresight optimization. Limited foresight optimization is a technique for simulating planning under incomplete knowledge of future events. Previously, LEAP only supported perfect foresight optimization. This new version allows you to easily create and compare multiple scenarios, each of which can simulate different degrees of foresight. It requires use of NEMO v2.2 or later. See this page for more information on how to use limited and perfect foresight optimization.
Fixed errors in expressions referencing non-fuel branches.
Stopped user from accidentally enabling certain UI elements during calculations (supporting screens, popups, etc.).
Support for disabling the LEAP task bar jump list, which can cause errors on some PCs. To disable jump lists, place a file named "taskbar.no" in the Program files\LEAP folder.
Updated and improved help system.
2024.2.0.3: 3/26/2025
Fixed possible file access error in optimization calculations.
Fixed writing of Transmission line cost and efficiency data from LEAP to NEMO.
Allowed exiting full screen mode from all views.
Improved show/hide branches screen.
Stopped possibility of accidentally hiding top level branches.
Fixed missing right-click popup menus in some screens.
Various other minor UI improvements.
2024.2.0.2: 3/22/2025
First version compiled with Delphi 12.3.
Improved support for high resolution (high DPI) screens and themes. Font sizing and other UI elements now scale better on high DPI monitors. More responsive UI when dragging LEAP windows between monitors with different scaling. Better sizing of chart components on high resolution screens.
Improved layout of the Fuels, Effects, and References screens.
Fixes error in Transformation calculations that could occur if a Transformation module was hidden in all regions of a multi-region model.
Improved writing of NEMO data files to better support data sets with whole year/seven day time-slicing.
Reintroduced Windows task bar jump lists for quick switching among areas and views. Right-click on the LEAP icon in the Windows task bar to access jump lists. Also enhanced the Task bar icon, which now shows progress during LEAP calculations.
Two new themes: orange and sky blue under the View: Theme menu option.
2024.2.0.0: 3/15/2025
Useful Energy Analysis: Added a new option to allow comprehensive useful energy analysis across all demand branches. Use the option marked "Calculate Useful Energy for All Demands" in the Settings:Scope screen to switch on this capability. When switched on, you will see an additional "Efficiency" variable at all demand technology branches in Analysis View. The result variables in Results View have been renamed for better consistency. Alongside one variable reporting Useful Energy Demand you will see a second variable named Final Energy Demand. This had previously been named "Energy Demand: Final Units".
Analysis View has been updated to make it easier to use and more responsive (faster). The selection boxes used to select branches, variables, scenarios, and regions have been replaced with easier-to-use menu buttons. The branch menu button now lets you filter branches based on the tags defined at branches. For example, instead of showing a very long list of power plants you can filter that list to show only combined cycle or renewable power plants, or perhaps existing vs. future power plants. The branch menu button also gives quick access to editing tags. The variable menu button lets you select one or all variables or only show certain categories of variables (e.g. all cost variables, or all dispatch-related variables). It also gives quick access to editing and adding user variables. The region menu button now lets you select one region, all regions, or groups of regions. The main data table is now much more responsive, especially when working with complex time-sliced variables. When viewing time-sliced variables in Analysis View charts, we have added the ability to show either years or branches in the chart legend.
To use tags for filtering branches in Analysis View, use the Tag Toolbar below the main tree to add tags to branches. You will then need to assign tags to different tag groups in the Manage Tags screen (F5). In the Tag Groups screen (Alt+F5) you can edit the names of groups or create additional groups. Note that any branch can have multiple tags. For example, one power plant could be marked as "Combined Cycle", "Fossil" and "Existing", each of which may be assigned to different tag groups. Finally, to use tags for filtering of branches in the Analysis View and Results View, be sure to enable the "Use for Results and Filtering" checkmark for reach relevant tag group. Bear in mind that you may have some tags that are used only for modeling purposes, and that you do not wish to use for filtering of branches.
Added Global Warming Potential values from the IPCC Sixth Assessment Report (2021) including data for GWPs, GTPs, AGWPs, AGTPs, and CGTPs. You can apply these to your area using the button marked "IPCC Assessment" in the General: Effects screen. Note that GTP, AGWP, AGTP, CGTP, and Radiative Efficiency values are for information only. LEAP's calculations currently only use GWP data. Note also that LEAP includes GWP factors from all six assessment reports. Most users (e.g. those doing national emissions reporting to the UNFCCC) should use the included GWP factors from AR5: the IPCC Fifth Assessment report.
Reorganized treatment of Planning Reserve Margins to fix a problem in full energy system optimization calculations that could result in infeasible solutions if two or more module's produced the same output fuel. This has necessitated moving the Planning Reserve Margin and Peak Load Ratio variables. Previously, they were listed only once for each fuel under the Load Shapes branches. Now they appear under each Transformation module.
Added a new checkbox in the properties dialog for Key Assumptions, Indicators and Non-Energy category branches that indicates whether results can be shown summed across the child branches of the category. The checkbox is marked "Allow summing of children with same units". When switched on, data in Analysis View charts for child branches will default to being shown in area charts, making it easier to visualize the total of any child branches specified in the same units.
When entering expressions in Analysis View, references to energy-related variables can now be specified in units that differ in class from how the referenced variable was originally entered. For example, you can refer to the energy intensity of a device using Natural Gas in kWh (energy units) even if the energy intensity was originally entered in cubic meters (volume units) To take advantage of this, specify the unit name or abbreviation within the square brackets that follow the branch/variable reference like this: "Device:Final Energy Intensity[kWh]". Certain limitations still apply. For example, you cannot reference a value in m3 if it was originally specified in kWh for a pure energy form such as heat or electricity, since such fuels by definition have no mass or volume.
Tree Icons: Changed how icons are displayed for demand technologies in the tree. Now, if fuel icons are enabled within the General: Fuels screen, demand technology branches will be displayed in the tree with the fuel icon corresponding to the fuel consumed within that technology. This is similar to how Transformation technologies and feedstock, auxiliary, and output fuels are displayed. When fuel icons are disabled, technologies will continue to show using one of the default technology icons.
Fixed a file management/file copying issue that could cause various "table not found" errors in 2024.1.1.15. Apologies to all who experienced this issue in the last version. In addition, file copying has now been made more fault resistant by adding the ability to retry the operation after it fails. This should not normally be required, but can still be useful in unusual circumstances such as when a file is locked or set to be read-only outside of LEAP.
Autocomplete and Chart Refresh Delay Times: You can now edit the time delay in milliseconds before autocomplete popup boxes or the Analysis View chart are updated. A longer time delay can be better when doing intensive editing in the Analysis View data entry grid. Edit these values in the Settings: Calculations screen.
To reduce the frequency and bandwidth of cloud synchronization operations (e.g. when LEAP Areas are located under a Dropbox or OneDrive folder), the location of various LEAP settings files previously stored under LEAP Areas\_Settings has now been moved to the folder "Appdata\Roaming\Stockholm Environment Institute\LEAP". This change also reduces the chances of files being locked or corrupted by cloud synchronization activities.
Improved Memory Management: Under the hood, we have revised the management of various key data structures to use more modern approaches. These new approaches will make LEAP more robust and reduce possible range error messages.
Fixed expression parsing bug that reported an error when an Interp, Step, or other time-series function contained parameters for years after the end year.
Eliminated writing of default NEMO parameters for ReserveMargin and ReserveMarginTagTechnology for compatibility with forthcoming new version of NEMO.
Fixed an issue in which temporarily unchecking and then rechecking an already calculated scenario would unnecessarily require that it be recalculated.
Fixed "Help on This Variable" button not working.
Years/Time slices selection box was sometimes not visible for time-sliced variables in Analysis View.
Submit button sometimes was disabled after edits in the Expression Builder.
Updated Help system to reflect above changes.
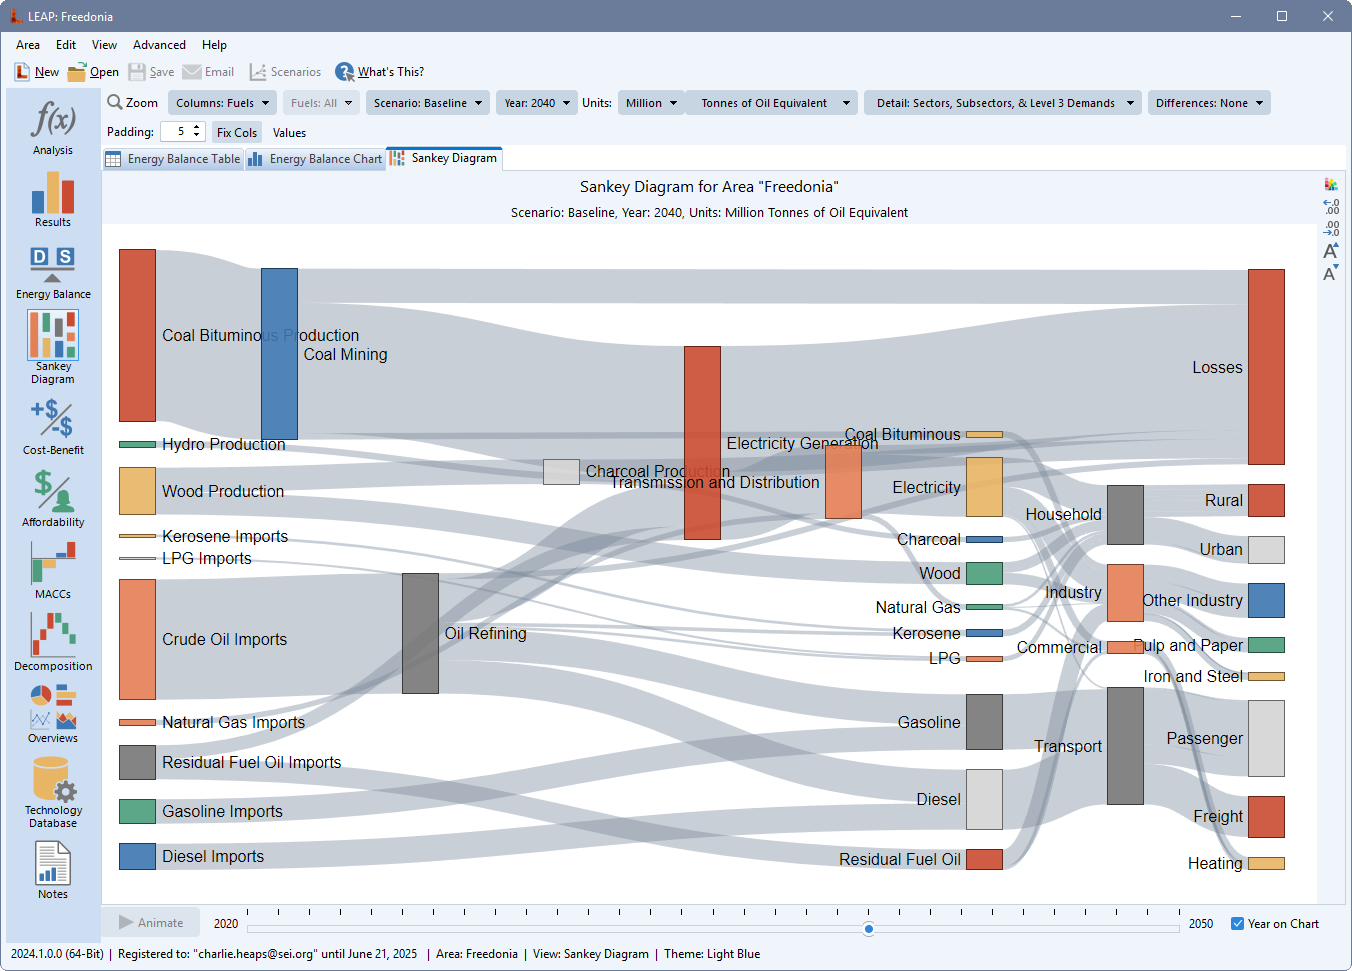
To support comprehensive Useful Energy Analysis, the Energy Balance and Sankey Diagram views have been upgraded to optionally display Useful Energy Demands, giving a better visualization of the overall energy efficiency and losses in energy systems. In these views, use the new toolbar button Show Useful Energy to show useful energy values. You can also include both final and useful energy demands as part of your decomposition analyses.
2024.1.1.15: 1/24/2025
Fixed scrolling problems in the main data entry table in Analysis View. In tables with a large number of records, after switching variable tabs, the table was sometimes not correctly sized within its containing tab.
Fixed problem introduced in 2024.1.1.4: Opening or installing an area would not correctly install any subfolders under the area folder. These folders do not contain LEAP data files, but may contain important supporting files such as CSV files or linked Excel spreadsheets.
API: Improved error messages when accessing LEAP variables. Removed error messages when accessing obsolete functions: These error messages can interfere with the autocomplete features in Visual Studio Code when using it to access LEAP as an API object.
2024.1.1.14: 1/20/2025
Further Update to Support Operation Under Dropbox/One Drive/Google Drive, etc.: The changes implemented in v2024.1.1.10 were not sufficient to fully support operation when LEAP Areas were located under a cloud synchronized folder. This new version now properly supports Dropbox/One Drive/Google Drive operation. Sorry for the inconvenience.
2024.1.1.12: 1/16/2025
Further minor improvements to evaluation of time-series expressions.
Edited Help system to properly document SeasonalValue, HourlyValue, and DailyValue functions.
Fixed bug when calling Area.backup from the API.
Added link to Terms and Conditions from About screen.
2024.1.1.10: 1/14/2025
This release has a large number of bug fixes. It is strongly recommended for all users.
Working Folder: Changed location of the temporary working folder from "LEAP Areas\_Settings\_Work" to a folder named "_LEAPWork" under the Windows %Temp% folder (normally "C:\Users\[UserName]\AppData\Local\Temp\"). This new location should be guaranteed not to be synchronized to a cloud service such as Dropbox, Google Drive, or OneDrive, and so should avoid the possibility of file locking errors caused by these services. Thus, with this change, we have also removed the warning message that appeared if you located your LEAP Areas under a folder that is cloud synchronized. It is now OK to have your LEAP Areas folder be cloud synchronized.
IBC (Impact Benefits Calculator) calculations: Fixed problem where the script used to extract results from LEAP and send them to IBC could sometimes send the wrong scenario's emissions results into IBC's input data file. If you have been using IBC in LEAP v2024 we strongly recommend that you recalculate your results, as this fix may cause important results variables such as avoided premature mortality to change. Note: IBC was originally known as the Integrated Benefits Calculator. It is now known as the Impact Benefits Calculator.
Optimization Calculations:. Fixed problem in full energy system optimization calculations where the capacity from one module could incorrectly be used to meet capacity needs in another module if the two module's had the same output fuels. Fixed reporting of reserve margin values.
Improved registration process to make it simpler and to help check that LEAP is being used with valid, up-to-date licenses. The menu option Help: Register Online now requires you to register a new copy of LEAP using the same user name (email) and password that you use to login to the LEAP website. Previously we supplied separate registration codes, which could cause confusion. These registration codes are no longer used or issued when you license LEAP. The Help: Register Offline option should now only be used by those people attending training workshops.
LEAP now requires periodic access to an internet connection so that it can communicate with the LEAP server. You will be alerted after a few days when LEAP has been running without internet access, and after 30 days LEAP will become inoperable until such time as an online connection has been established.
Branch/Variable Wizard: Now supports selecting user variables under Key Assumptions and Indicators. Fixed a problem where the Finish button was disabled when referencing variables that use percentage units.
LEAP Cloud Data Server (LCDS): When referencing data from the U.N. energy statistics it was not possible to get totals for a particular flow code (sector) across all fuels as the "total" series was not working correctly. This series has now been removed. In its place, you can now get total energy flows across all fuels for a particular flow code using a new product code "TL" for total. Thus, you can now retrieve energy statistics either in their native physical units, in consistent energy units (TJ), or as percentage shares for each fuel's share of the total energy consumed in each flow code. Coming soon - the LCDS will be updated to include the latest U.N. energy statistics and the latest U.N. population prospects. Please use menu option Advanced: Force LCDS to Refresh to ensure you can access these changes in the LCDS if using an older version of LEAP.
Time-Series Wizard: Now has better support for getting data from the LCDS. The wizard now properly handles functions containing explicit ISO3 country codes and also now shows you the URL used to query the LCDS so that you can easily view the query results in a web browser.
Exporting Notes to MS-Word: Fixed error message when exporting blank notes to MS-Word. Added back the option to support exporting all notes across all branches to MS-Word. This capability had been included in LEAP2020 and earlier.
Fixed problems in evaluation of complex time-series functions (Interp, Step, etc.). Function parameters were unnecessarily being evaluated for years after the year for which a result was required, which could cause unnecessary circular reference errors and slowed down performance. Also fixed evaluation of parameters referencing other variables or parameters referencing prior year values. Fixed forecasting functions and created new LinForecastCA and ExpForecastCA functions that forecast values into the future while returning actual data values in Current Accounts years. Also improved reporting of errors when evaluating time series functions.
Improved/updated help with new pages covering the LEAP registration process, the LEAP Cloud Data Server (LCDS), references to the LCDS in functions, and updated information describing IBC. Added pages for the new LinForecastCA and ExpForecastCA functions. Other general improvements to Help such as reviewing and fixing external links.
Improved handling of situations where the Windows list separator and decimal separator characters are the same (e.g. on Swedish PCs, both may be set to be the comma character). LEAP now uses a semi-colon as the list separator in these situations and no longer shows an error asking you to edit your Windows Regional settings.
Fixed range errors when adding a new Transformation process.
Fixed range errors in areas containing hidden storage processes.
2024.1.1.9: 10/31/2024
Fixed problems handling minimum and maximum production constraints in optimization scenarios.
Tree icons now immediately refresh to show proper fuel icons when adding a new branch.
2024.1.1.8: 10/29/2024
Further fix to allow indicator variables to be properly reported in Results View.
2024.1.1.7: 10/29/2024
Improved/fixed reporting of data variables, user variables, and the TotalActivity variable in Results View.
Fixed problem with loading/saving favorite charts. Newly created favorite charts were lost after clicking the save button.
Fixed treatment of MinShareProduction optimization variable.
Fixed rounding error affecting writing of default values to NEMO data files.
Fixed writing of OutputActivityRatio variable to NEMO data files for supply technologies.
Cleaned up the Help menu, which was showing a debug-only option.
Improved handling of the Growth function to allow it to be used in Current Accounts from the first scenario year onwards. This was allowed in LEAP2020, but was not working in LEAP2024.
Now checks for and disallows attempts to create expressions that reference variables that are optimized by NEMO.
Updated the notes editing component. Fixes various issues such as text formatting occasionally getting corrupted when pressing the Ctrl+Shift+Right key.
2024.1.1.6: 10/14/2024
Fixed duplicate Yes/No buttons showing in Help:Check for Updates dialog. If Update process abandoned by user, LEAP no longer reports this as an error.
2024.1.1.5: 10/14/2024
Highlighting Current Branch: In Analysis and Results View, tables in the bottom-right part of the screen now automatically highlight a cell in the row of values corresponding to the currently selected tree branch (or the branch being edited in the Analysis View data entry table if different).
Improved chart selection menu. Checkmarks now properly indicate if bar charts are stacked or not and properly disable stacked and percent stacked options when they are not valid.
Improved handling of upper limit constraint values that are set to "Unlimited". These values are no longer written to NEMO's input files, resulting in reduced solver scaling.
Bug Fix: Edits to notes were getting lost when clicking variable tabs, main menu, or main toolbar buttons.
Big fix: OK button in image selection dialog of Notes editor not working. Also, have also put a limit on the size of selectable images to less than 1 MB. This helps to ensure sufficiently responsive operation.
Bug fix: Resource costs were not being passed to energy system optimization calculations unless the scope of cost-benefit calculations was set to "Complete Energy System".
Bug fix: Fixed issue during optimization calculations where the error "Shortfalls cannot be met by extra imports when using Optimization" could appear, even though the Shortfall Rule variable for output branches is not valid in optimized modules.
IBC core data was being incorrectly erased when dictionary was reinstalled.
Further fix to API function: LEAP.BranchVariable, which was affecting calculations of IBC-based datasets.
Fixed error "Query preparation failed" in Results View when legend is set to selected branches and branch levels are then changed.
2024.1.1.4: 10/5/2024
Further fix to ensure all years can be selected on X axis of charts and tables.
Fixed various possible range errors and access violations on startup and when showing results that include growth rate columns.
Improved layout of columns of diagnostics table in Results View.
Properly remembers spell check highlighting settings between sessions.
Improved X axis label separation drawing in charts.
Disallowed selecting log scale on charts with negative values.
Improved editing in time-series wizard.
Fix to API function: LEAP.BranchVariable.
2024.1.1.2: 9/27/2024
Fixed possible floating point error in charts and tables when showing optional growth statistics.
Option to toggle Historical Data/Scenario Projections divider in Results View charts was not working.
X axis years settings in Analysis view were not working correctly when switching between Analysis View and Results view.
Fixed possible range error when switching between areas.
Improved behavior of tree when clicking on "v" and ">" buttons to the left of tree icons.
Improved handling of scripts with insufficient permission to run on a computer.
Improved display in tables of tiny numbers less than 1E-9.
Removed embedded help on Results View tables. On slow internet connections, this was causing the LEAP UI to be insufficiently responsive. Press Help (F1) to access these pages.
2024.1.1.1: 9/25/2024
Fix for incorrect planning reserve margin values being sent from LEAP to NEMO - values were incorrectly accounting for the value of the Peak Load Ratio variable.
2024.1.1.0: 9/25/2024
New result variable "Timesliced Primary Requirements" shows primary fuel requirements divided into the direct final demand for fuels (Demand) and secondary requirements (Transformation). Shows results for any fuel that has a time sliced demand load shape or which is an input to Transformation. Only available for optimization-based scenarios.
Fixed various problems in expression parsing:
Referring to variables sometimes returned an erroneous error: Invalid Branch\Variable Combination. This could be due to LEAP having multiple variables with the same name at different branches (e.g. Capital Cost). LEAP was not properly using the branch context and thus was sometimes returning the wrong variable, which was flagged as an error if that variable was not valid where referenced.
Branch names that themselves contain operator keywords AND, OR, NOT or XOR could not be referenced in expressions. For example references to "Transmission and Distribution" were causing an error because LEAP was interpreting this as two variables separated by a logical operation.
Valid branch/variable name references including the "\" character were sometimes generating the error: Bad Character: "\".
References to the "Year" constant were only working if the word was written in all lower case. Note that "Y" is no longer allowed as a synonym for "Year".
Improved color coding of expressions in the Analysis View data entry grid. A number of users reported that it was hard to distinguish between the blue text used to indicate expressions explicitly entered in a particular scenario and the black text used to display inherited expressions. LEAP now uses purple text to indicate explicitly entered expressions. It continues to use green text to indicate an expression inherited from another region. Expressions containing errors are shown as red italicized text. The data grid also now shows these text colors even when an expression is highlighted.
Fixed bug in specifying demand load shapes for non-electric fuels in cases where energy intensity is specified at the end use level.
Fixed various issues checking inputs and writing input files for NEMO when using transmission modeling.
Added additional error checking of variables that are inputs to NEMO optimization calculations.
Stopped unnecessary error checking of nodal distribution shares for branches that are hidden.
Improved checking of from/to nodes of transmission lines.
Improved diagnostic messages used to check use of historical dispatch method.
Fixed issue with "Don't ask again" checkboxes in dialog boxes.
Fixed hidden years selection box in Decomposition reports.
Fixed registration form colors, placement, and ungrammatical warning message.
Renamed variable "Efficiency" used in Transmission calculation to become "Transmission Efficiency".
Fixed energy system optimization calculations to properly deal with the possibility of imported secondary fuels.
Fixed scaling factors on transmission line costs (was saving as dollars - should have been million dollars).
Fixed incorrect calculation of transmission line costs when they are specified per unit distance.
Chart options now saved to .txt files rather than .ini files. (e.g. Report.ini is now ReportINI.txt). Some anti-virus programs such as EndPoint were erroneously flagging the .ini files as malware. They were not, but this change should prevent EFCreateFile error messages seen on some systems.
Fixed problem in script editor, where word wrapping was being interpreted as a line break: thereby causing valid scripts to fail.
Fixed problem when pasting text into the Expression Builder when the cursor was before the first character of existing text in the Builder.
Fixed range error in wedge charts when number of branch levels is greater than one.
Optimization calculations were not properly utilizing dynamic values for planning reserve margin.
2024.1.0.7: 8/15/2024
Fix for missing data in the LCDS cloud database for some indicators from the World Bank, World Development Indicators (WDI). Also updated to the latest 2024 version of the WDIs with national data now running from 1960-2023.
Added option under Advanced menu to force the LCDS to refresh its data dictionary from the cloud.
Fixed sizing problems with some of the confirmation/warning dialog boxes when using certain monitors & graphics cards. Unfortunately, LEAP's development environment (Delphi) is still a bit buggy when showing themed dialog boxes, so we have switched off themes in dialog boxes for now. We will aim to re-enable this feature once we have adopted the next release of Delphi.
Splash screen now appears more quickly when launching LEAP. The previous delay could cause people to mistakenly launch two instances.
2024.1.0.4: 8/8/2024
Stock turnover calculations: Fixed bug affecting scaling of future sales data when using bottom-up stock and sales data.
Improved robustness of importing yearly shapes from hourly data from an Excel spreadsheet. Now handles situations where the sheet has invalid values or Excel is in editing mode or otherwise unavailable.
LEAP was incorrectly checking the methods used to specify load shapes across regions & scenarios, causing it to disallow some valid choices.
Fixed miscalculation of system load shapes in Current Accounts years when load shape methods were set to vary between Current Accounts and a scenario.
Improved feedback shown when a result variable is not available for display in Results view.
Standardized the location of the web browser cache files to reduce file access problems.
2024.1.0.3: 7/31/2024
Dark Mode Help: Help system now supports dark mode (white text on a dark background).
Fixed error: "Cannot refer to a year before the area's base year". This was allowable in LEAP v2020 and has now been re-enabled in v2024.
Removed superfluous files that are no longer needed due to the removal of support for OSeMOSYS - resulting in slightly smaller (~2MB) downloads.
2024.1.0.2: 7/28/2024
Fixed Bug in Language Translations of Data Names: Fix for UTF encoding error when using the Area: Language: Data feature on PCs running Chinese and other multi-byte character versions of Windows.
Spell Checking: Improved behavior of the notes spelling checker. Now immediately regenerates the red squiggly lines under misspelled words as soon as you select another language dictionary. Please contact us (leap@sei.org) if you are able to help review software translations. So far we have published translations in 14 different languages, but we have complete machine translations in another 40 languages ready for volunteer review.
Transmission Modeling: Renamed variable Capacity to "Transmission Capacity" to avoid clashes with other branches or variables containing the word "capacity".
2024.1.0.1: 7/23/2024
More than two years in the making, LEAP 2024 is a major update designed to make policy-relevant analysis easier to undertake, more accessible, more rigorous, more credible, more inclusive, and better able to address important emerging concerns.
New features in this version include:
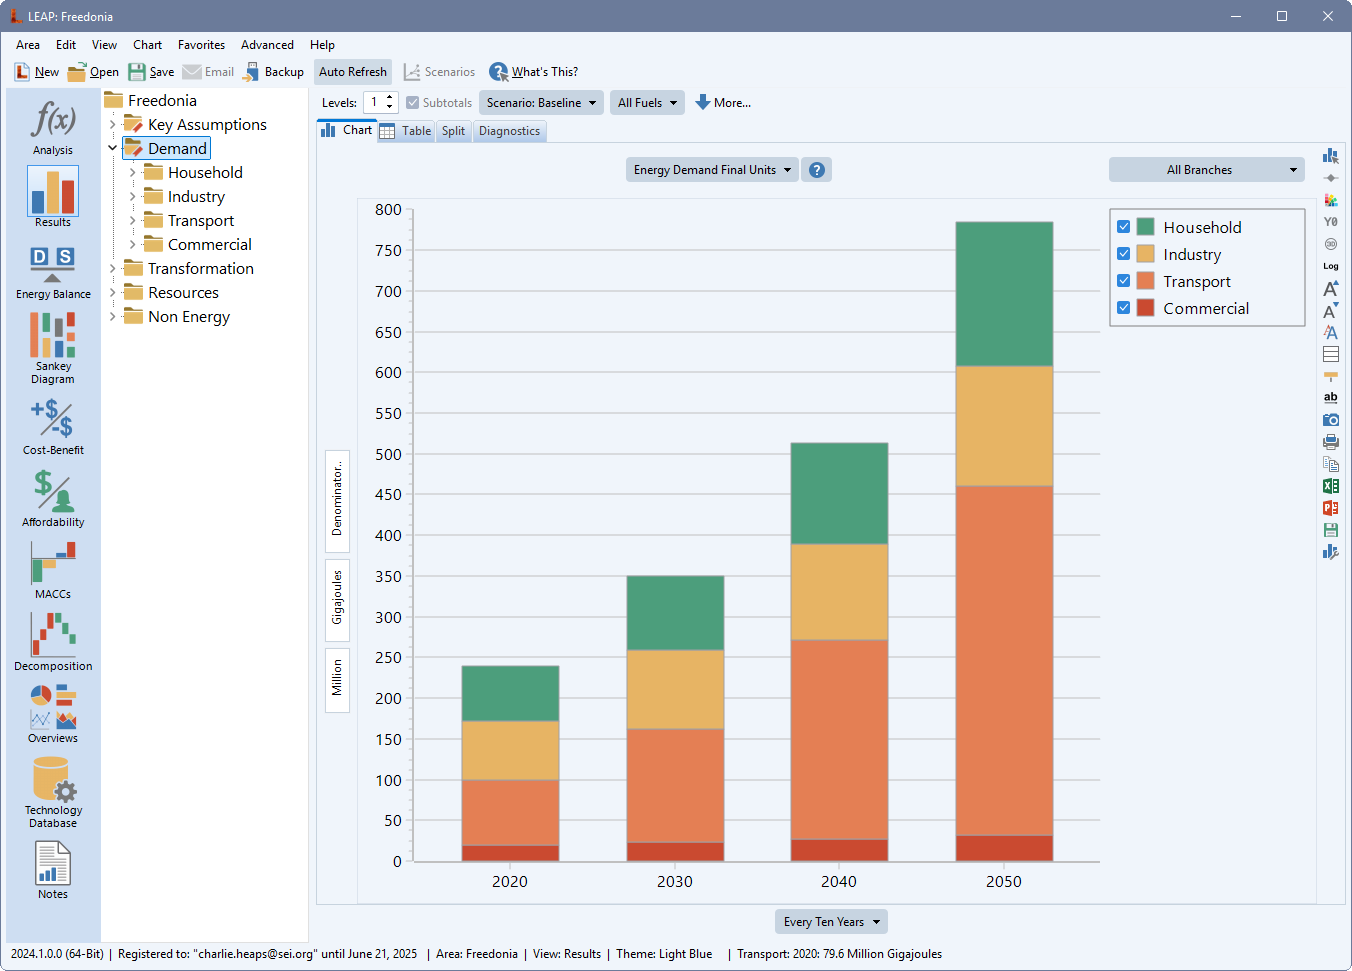
 A Modern User Interface: We have given LEAP's user interface (UI) a major revamp: making it more professional looking, more configurable, and easier and more enjoyable to use.
We have also taken great care to ensure LEAP is immediately recognizable and usable by its many existing users.
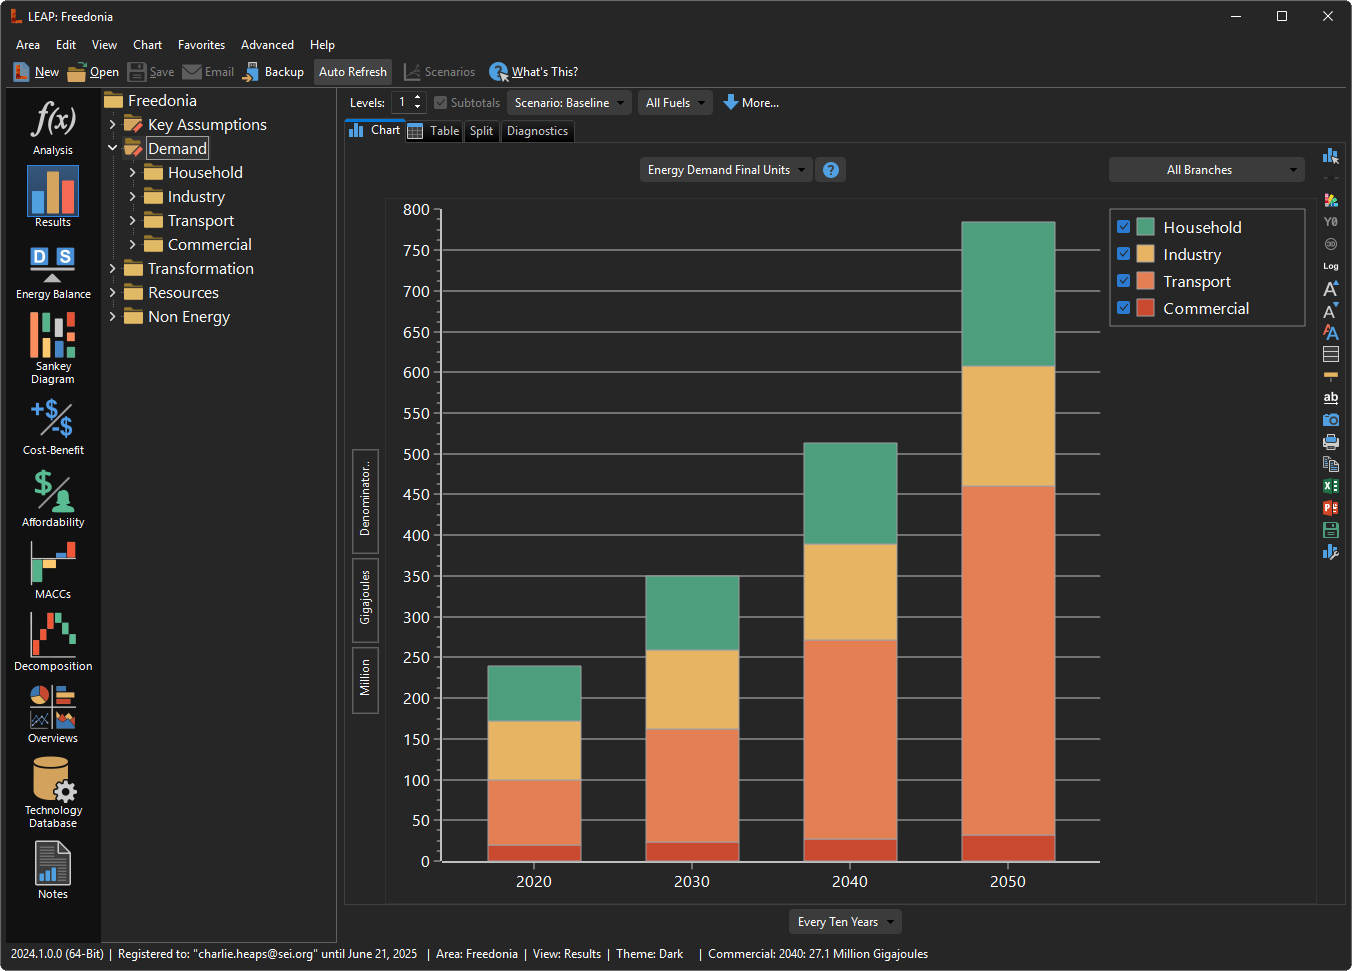
The new interface includes updated icons, support for the latest high-resolution monitors, better use of color, and support for both light and dark themes.
In addition to these major changes, we have also implemented many other improvements to improve the usability of LEAP as described below.
Shown above are a few images showing examples of some of LEAP's screens within the new user interface using various different color themes including the new dark mode.
A Modern User Interface: We have given LEAP's user interface (UI) a major revamp: making it more professional looking, more configurable, and easier and more enjoyable to use.
We have also taken great care to ensure LEAP is immediately recognizable and usable by its many existing users.
The new interface includes updated icons, support for the latest high-resolution monitors, better use of color, and support for both light and dark themes.
In addition to these major changes, we have also implemented many other improvements to improve the usability of LEAP as described below.
Shown above are a few images showing examples of some of LEAP's screens within the new user interface using various different color themes including the new dark mode.  Energy System Optimization: For years, LEAP has supported a wide choice of methods including both simulation and optimization approaches.
Until now, LEAP was limited to doing partial optimization of only a single sector in an energy system (e.g., electric generation).
LEAP 2024 now supports full least-cost energy system optimization - taking full advantage of the capabilities of NEMO (LEAP's companion optimization framework).
In addition to optimizing all of Transformation, LEAP can now also optimize selected demand end uses (those specified with useful energy demands) and in multi-region models can also model pipeline & transmission networks.
These new capabilities are important for modeling deep decarbonization and net zero pathways. For example, you can now specify overall constraints on GHGs and other pollutant emissions and calculate the least-cost energy system configuration that meets those constraints.
The latest version implements these features in ways that make them straightforward to apply. LEAP makes full use of any data already entered into a model.
You need only add in any extra data required for optimization, such as additional modeling constraints. In addition, all results can be viewed directly within LEAP in standard formats familiar to planners.
Energy system optimization can be conducted for specific scenarios and results can be compared to those calculated in simulation- or partial optimization-based scenarios.
More information on setting up full energy system optimization.
Energy System Optimization: For years, LEAP has supported a wide choice of methods including both simulation and optimization approaches.
Until now, LEAP was limited to doing partial optimization of only a single sector in an energy system (e.g., electric generation).
LEAP 2024 now supports full least-cost energy system optimization - taking full advantage of the capabilities of NEMO (LEAP's companion optimization framework).
In addition to optimizing all of Transformation, LEAP can now also optimize selected demand end uses (those specified with useful energy demands) and in multi-region models can also model pipeline & transmission networks.
These new capabilities are important for modeling deep decarbonization and net zero pathways. For example, you can now specify overall constraints on GHGs and other pollutant emissions and calculate the least-cost energy system configuration that meets those constraints.
The latest version implements these features in ways that make them straightforward to apply. LEAP makes full use of any data already entered into a model.
You need only add in any extra data required for optimization, such as additional modeling constraints. In addition, all results can be viewed directly within LEAP in standard formats familiar to planners.
Energy system optimization can be conducted for specific scenarios and results can be compared to those calculated in simulation- or partial optimization-based scenarios.
More information on setting up full energy system optimization.  The LEAP Cloud Data Server (LCDS): The LCDS is a new easy-to-use system for connecting LEAP models to an internet-hosted database containing international open-source data covering energy, emissions, and development topics.
The LCDS simplifies data collection and model maintenance - allowing users to easily update their models as new data becomes available.
The initial version of the LCDS provides nationally oriented statistics useful to energy modelers including UN population prospects, UN urbanization data, UN energy statistics, Word Bank development indicators, EDGAR emissions database, KAPSARC Cooling and Heating degree days, etc.
Data from the LCDS can easily be pulled into a LEAP model using LEAP's Time-Series Wizard.
That data is then cached locally so that the data can be used even if you do not have an active internet connection.
Once a LEAP model is linked to the LCDS, LEAP will regularly check with the LCDS server to see if more up-to-date data is available.
If so, LEAP will alert you and offer to update your model with the new data.
The LCDS database and its RESTFUL API are open-source, and we will be making them available so that other modeling tools can also use the LCDS to help their users find and maintain modeling data.
The LCDS server itself can be accessed online here. More information on using the LCDS available here.
The LEAP Cloud Data Server (LCDS): The LCDS is a new easy-to-use system for connecting LEAP models to an internet-hosted database containing international open-source data covering energy, emissions, and development topics.
The LCDS simplifies data collection and model maintenance - allowing users to easily update their models as new data becomes available.
The initial version of the LCDS provides nationally oriented statistics useful to energy modelers including UN population prospects, UN urbanization data, UN energy statistics, Word Bank development indicators, EDGAR emissions database, KAPSARC Cooling and Heating degree days, etc.
Data from the LCDS can easily be pulled into a LEAP model using LEAP's Time-Series Wizard.
That data is then cached locally so that the data can be used even if you do not have an active internet connection.
Once a LEAP model is linked to the LCDS, LEAP will regularly check with the LCDS server to see if more up-to-date data is available.
If so, LEAP will alert you and offer to update your model with the new data.
The LCDS database and its RESTFUL API are open-source, and we will be making them available so that other modeling tools can also use the LCDS to help their users find and maintain modeling data.
The LCDS server itself can be accessed online here. More information on using the LCDS available here.  LEAP Plugins: The 2024 version of LEAP introduces a new architecture that allows LEAP models to be created by quickly plugging together mini models known as "LEAP Plugins".
These plugins can be developed and maintained by subject-matter experts (SEI and 3rd party) and an online repository will be coming soon to the LEAP website where you will be able to upload plugins
to share them with the wider LEAP community or download plugins to help build your own LEAP models.
Plugins can contain standardized methodologies for modeling particular sectors and can include data structures, modeling equations, documentation, and default data.
When used with the LCDS, plugins can even include default data that varies by country. Plugins can be created in LEAP and easily shared as single ".LEAPPlugin" data files from the new top-level Plugin menu.
Plugins will make model development easier, more modular, more standardized, and more community driven.
More information on creating and using Plugins.
LEAP Plugins: The 2024 version of LEAP introduces a new architecture that allows LEAP models to be created by quickly plugging together mini models known as "LEAP Plugins".
These plugins can be developed and maintained by subject-matter experts (SEI and 3rd party) and an online repository will be coming soon to the LEAP website where you will be able to upload plugins
to share them with the wider LEAP community or download plugins to help build your own LEAP models.
Plugins can contain standardized methodologies for modeling particular sectors and can include data structures, modeling equations, documentation, and default data.
When used with the LCDS, plugins can even include default data that varies by country. Plugins can be created in LEAP and easily shared as single ".LEAPPlugin" data files from the new top-level Plugin menu.
Plugins will make model development easier, more modular, more standardized, and more community driven.
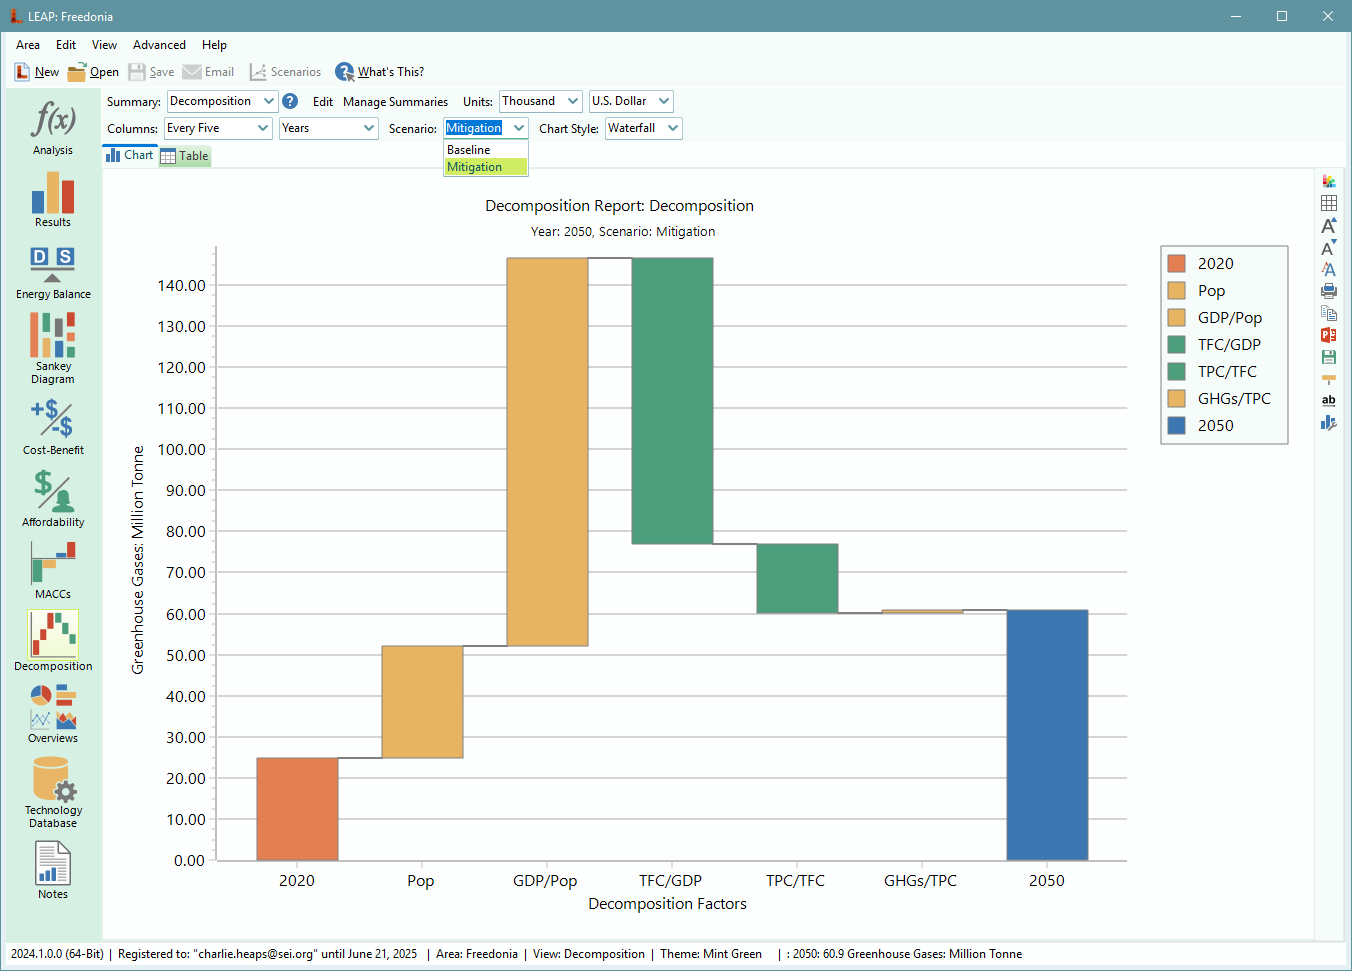
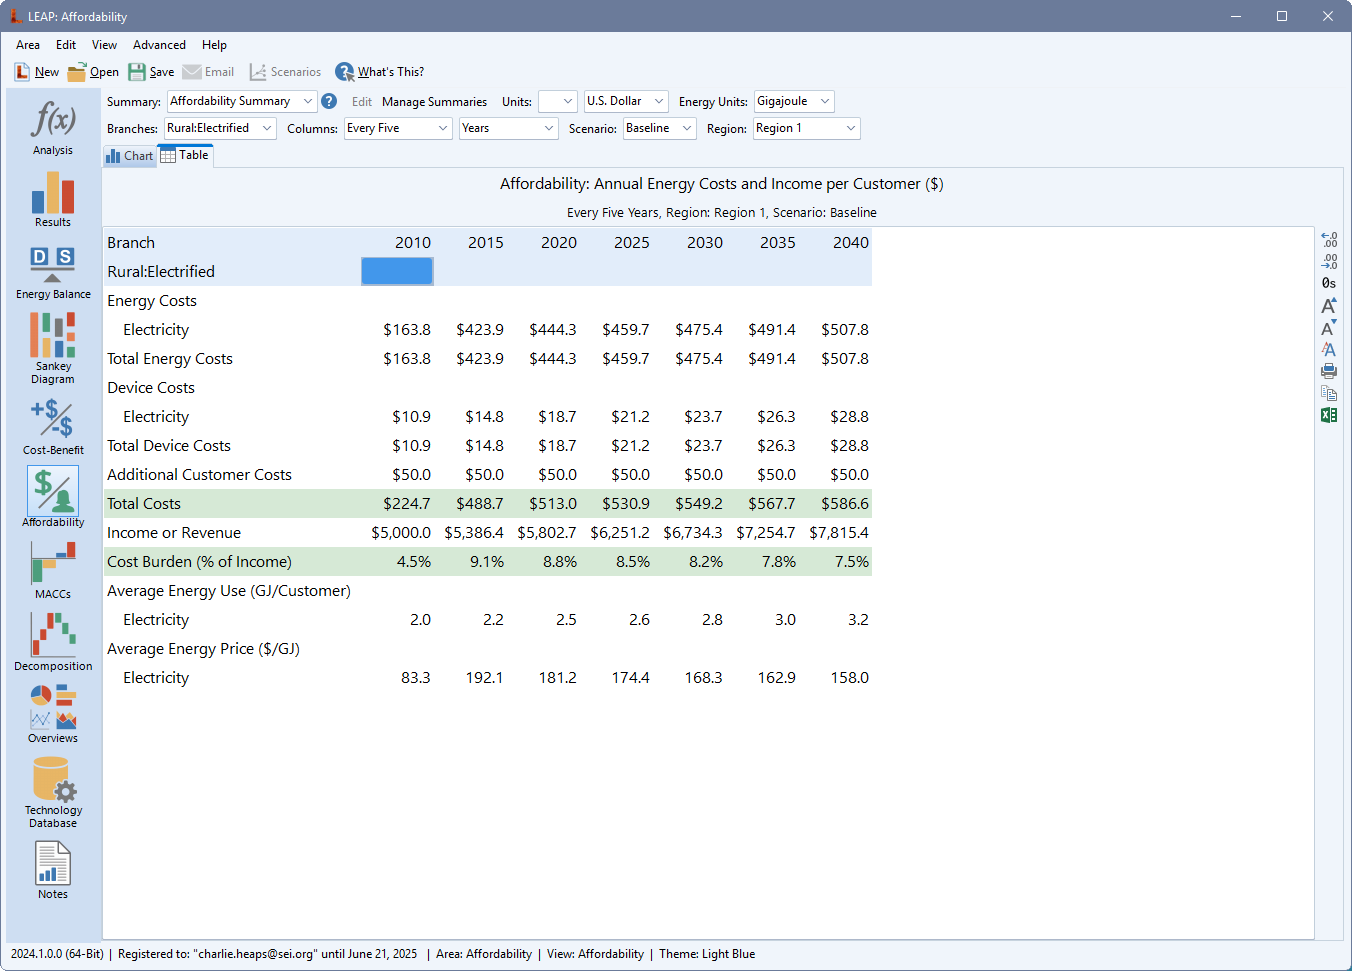
More information on creating and using Plugins. Energy Affordability: Examining the overall social costs and benefits of low carbon climate pathways is important, but so is considering how these pathways will impact on diverse groups, and especially the most vulnerable and marginalized members of society.
Most climate solutions are by nature highly capital intensive, so it is vital to consider how proposed solutions can be made affordable for lower income communities and important industries.
LEAP now includes an optional new type of analysis that helps users to study the affordability of pathways for different groups.
It includes the ability to specify detailed energy tariff (price) structures including different block rates that vary by usage or time of day. The analysis also allows you to consider the costs of energy-using devices and the effect of different possible subsidies that might support certain groups of consumers.
The analysis also lets you specify the incomes of affected households (or the revenue of affected industries) and uses this information to report on the overall burden of energy costs.
You can access these new Affordability Reports as a view in LEAP's View Bar.
More information on Affordability Analysis.
Energy Affordability: Examining the overall social costs and benefits of low carbon climate pathways is important, but so is considering how these pathways will impact on diverse groups, and especially the most vulnerable and marginalized members of society.
Most climate solutions are by nature highly capital intensive, so it is vital to consider how proposed solutions can be made affordable for lower income communities and important industries.
LEAP now includes an optional new type of analysis that helps users to study the affordability of pathways for different groups.
It includes the ability to specify detailed energy tariff (price) structures including different block rates that vary by usage or time of day. The analysis also allows you to consider the costs of energy-using devices and the effect of different possible subsidies that might support certain groups of consumers.
The analysis also lets you specify the incomes of affected households (or the revenue of affected industries) and uses this information to report on the overall burden of energy costs.
You can access these new Affordability Reports as a view in LEAP's View Bar.
More information on Affordability Analysis.-
 Accessibility and Translations: New translations of the user interface make LEAP more accessible than ever and help improve engagement.
Using Google machine translations combined with volunteer review, we have created new translations of the LEAP user interface to make it more accessible.
We have prioritized translations in languages that are important in Africa and Asia - not just the standard U.N. languages.
So far, we have created translations for: Albanian, Bosnian, Chinese, French, Gaelic, Indonesian, Malay, Portuguese, Spanish, Tagalog, Thai, Swahili, Urdu, and Yoruba.
Special thanks to those who volunteered their time to review these translations. Please see the credits page for their names.
We have already created more machine-based translations for other languages, but these still need to be reviewed.
We would love to hear from you if you are able to volunteer to review these additional languages.
Accessibility and Translations: New translations of the user interface make LEAP more accessible than ever and help improve engagement.
Using Google machine translations combined with volunteer review, we have created new translations of the LEAP user interface to make it more accessible.
We have prioritized translations in languages that are important in Africa and Asia - not just the standard U.N. languages.
So far, we have created translations for: Albanian, Bosnian, Chinese, French, Gaelic, Indonesian, Malay, Portuguese, Spanish, Tagalog, Thai, Swahili, Urdu, and Yoruba.
Special thanks to those who volunteered their time to review these translations. Please see the credits page for their names.
We have already created more machine-based translations for other languages, but these still need to be reviewed.
We would love to hear from you if you are able to volunteer to review these additional languages.In addition to the translation of LEAP itself, we have also implemented a new feature that works with Google Translate to translate all the names in your LEAP model (branch names, fuel names, scenarios, effects, tags, etc.) into different languages. You can even have multiple language translations within a single model and quickly switch between those via the Area: Language menu option - thus providing more options for engagement among modelers and stakeholders.
Other New Features: Aside from the major features listed above, we have made numerous smaller changes to LEAP to improve its usability by making modeling, data entry, and results visualization easier and more convenient. Examples of these improvements include:
 Editing Bookmarks: New editing bookmarks make navigating within your model quicker and more convenient. Bookmarks are shown as small red bookmark icons overlaying the main icons in the LEAP tree.
Press Ctrl+M to set or remove a bookmark. Press Alt+M to jump among set bookmarks. More information on setting and using bookmarks.
Editing Bookmarks: New editing bookmarks make navigating within your model quicker and more convenient. Bookmarks are shown as small red bookmark icons overlaying the main icons in the LEAP tree.
Press Ctrl+M to set or remove a bookmark. Press Alt+M to jump among set bookmarks. More information on setting and using bookmarks. A New Help System: LEAP's help system has been thoroughly revised and expanded to cover all the new capabilities in LEAP 2024
and now contains more than 650 separate help topics.
The new help pages are significantly easier to read and navigate than in previous versions. More information on the new help system.
A New Help System: LEAP's help system has been thoroughly revised and expanded to cover all the new capabilities in LEAP 2024
and now contains more than 650 separate help topics.
The new help pages are significantly easier to read and navigate than in previous versions. More information on the new help system. New Training Materials: In addition to revising LEAP and its documentation, we have also revised, updated, and expanded LEAP's training materials to make sure they reflect the latest changes.
The written version of these materials are available now in English.
We plan on producing new versions of these materials in additional languages soon.
Please email us at leap@sei.org if you are able to volunteer to help review these materials.
Similarly, we plan on updating the walkthrough training videos that accompany the training materials soon.
In the meantime, please bear in mind that the existing videos on the LEAP YouTube channel, while still broadly useful, reflect the UI and capabilities of the previous version of LEAP (LEAP2020).
New Training Materials: In addition to revising LEAP and its documentation, we have also revised, updated, and expanded LEAP's training materials to make sure they reflect the latest changes.
The written version of these materials are available now in English.
We plan on producing new versions of these materials in additional languages soon.
Please email us at leap@sei.org if you are able to volunteer to help review these materials.
Similarly, we plan on updating the walkthrough training videos that accompany the training materials soon.
In the meantime, please bear in mind that the existing videos on the LEAP YouTube channel, while still broadly useful, reflect the UI and capabilities of the previous version of LEAP (LEAP2020). Improved Editing and Documentation: The built-in documentation features in LEAP have been improved with more powerful word processing capabilities, better importing and exporting capabilities,
and a new real-time spelling checker that supports multiple languages. More information on the new editing capabilities.
Improved Editing and Documentation: The built-in documentation features in LEAP have been improved with more powerful word processing capabilities, better importing and exporting capabilities,
and a new real-time spelling checker that supports multiple languages. More information on the new editing capabilities.View Bar: An expanded "view bar" better highlights LEAP's analytical and results visualization capabilities. In addition to its previous views, the View Bar now gives direct access to Sankey Diagrams, Affordability Reports, Marginal Abatement Costs Curves (MACCs), Decomposition Reports, and Social Cost-Benefit Summary Reports.
 Heat Maps: In Results View, you can now show tables of results as "heat maps" that highlight the lowest and highest values in a table.
Table values can be grouped into thirds, quartiles, quintiles, deciles, or percentiles with the table values shaded according to which group of values each cell belongs to.
Heat Maps: In Results View, you can now show tables of results as "heat maps" that highlight the lowest and highest values in a table.
Table values can be grouped into thirds, quartiles, quintiles, deciles, or percentiles with the table values shaded according to which group of values each cell belongs to. Improved Energy Balances: Energy balances have been made more flexible. You can now optionally show them with additional rows showing more demand and transformation detail.
Alternatively, you can show a simplified energy balance with just three rows summarizing primary supply, transformation, and demands - useful when debugging your results.
Improved Energy Balances: Energy balances have been made more flexible. You can now optionally show them with additional rows showing more demand and transformation detail.
Alternatively, you can show a simplified energy balance with just three rows summarizing primary supply, transformation, and demands - useful when debugging your results. Quality: LEAP 2024 fixes many bugs and has gone through more rigorous testing than any previous version, including months of testing by a team of external beta testers.
Thanks to those volunteers for their help and feedback!
LEAP 2024 is fully backwards compatible with previous versions, meaning it will seamlessly upgrade and use any models developed in earlier versions of LEAP.
Quality: LEAP 2024 fixes many bugs and has gone through more rigorous testing than any previous version, including months of testing by a team of external beta testers.
Thanks to those volunteers for their help and feedback!
LEAP 2024 is fully backwards compatible with previous versions, meaning it will seamlessly upgrade and use any models developed in earlier versions of LEAP.Deprecated: A number of features from previous versions of LEAP have now been removed. LEAP no longer supports the OSeMOSYS optimization framework. We have chosen to focus our development efforts only on NEMO since it is faster and has more capabilities such as modeling of storage and transmission networks and works with more solvers. In addition, we have removed the now outdated "information pages" from the TED database. In the longer term, we expect that TED itself will be superseded by the new LCDS cloud database. Finally, please note that this latest version of LEAP requires Windows 7 or later. We no longer support Windows XP or earlier.
Videos from the launch webinars held on July 11th are available on the LEAP YouTube Channel.. There is one longer video replay of the whole webinar, and we've also created short highlight videos introducing each of the above new features.
LEAP 2020
2020.1.114 7/17/2024
Fixed missing buttons in Results View chart and table toolbars (problem introduced in .113).
2020.1.113 7/4/2024
Fixed rare issue where a reference to an activity level variable from an expression for another variable at the same branch would be incorrectly handled.
2020.1.112 3/6/2024
Further fixes to address "Cannot modify read-only data set" error messages, which seem to be caused by recent changes in LEAP's database engine.
Made internet communications on LEAP startup more robust to deal with situations of poor internet connectivity.
2020.1.111 3/6/2024
Bug fix: Minor changes to address errors regarding inability to access read-only database tables.
2020.1.110: 3/1/2024
Bug fix: Not properly showing data variables including Activity Level and Total Activity in Results view.
Bug fix: The options for "Handling Insufficient Capacity Additions" on the Settings: optimization screen were not working correctly. These options control whether insufficient capacity is reported directly as a solver error or is reported within LEAP and as an error or a diagnostic message. For most users, we recommend that you have such errors reported by LEAP.
Tip: To support reporting such errors, LEAP creates a special hidden process named UNSERVED with very high capital costs. This reduces the chances of the solver reporting an infeasible solution, but if any of this process gets built, then LEAP reports this as an error.Bug fix: Updated the underlying database engine used by LEAP, which had a bug related to indexing of database tables and which seemed to be causing occasional Access Violation errors when using LEAP. To address this, all area database files will be packed and re-indexed when an area is first opened in the new version of LEAP. This operation takes about a minute and is a one-time operation.
2020.1.109: 1/22/2024
Fixed the ability to specify carryover of energy between years, seasons, day-types and hourly periods in storage processes. Carryover can only be specified for storage processes and must be edited within Current Accounts using Yes/No variables. Note also that currently energy storage can only be modeled in optimization-based scenarios. These variables are static and cannot be altered in different scenarios. The "Daily Storage Carryover" variable has been renamed to become "Hourly Storage Carryover". The old name was confusing since it is used to specify whether energy stored in one sub-daily (e.g. hourly) period can be carried over to be used in subsequent sub-daily periods. Some of these settings were previously not working as intended (for example if you had specified 8760 hourly time slices). The variables were either not visible in certain situations or their values were not being properly written into NEMO's input database.
Fixed display problems in the time slices setup screen.
2020.1.107: 1/11/2024
Bug fix:Interest rate values not being correctly written to NEMO for storage processes. LEAP was incorrectly writing an interest rate value of zero for storage processes. This tended to make LEAP over-build and over-dispatch storage technologies. This is now fixed. Expect to see slightly different results (less use of storage) calculated for optimization scenarios that include energy storage processes in cases where you have specified non-zero interest rates for those processes.
2020.1.106: 11/16/2023
Added extra error checking and improved error reporting to ensure that all branches are properly linked to valid/existing fuels. Range errors could occur if branches were linked to fuels and if those fuels were then subsequently deleted.
Improved error handling for invalid references to results variables and for reporting circular branch/variable references.
Fixed issue where entries for the Device Share variable were not being shown in Analysis View when using stock turnover methods.
Improved various screens to ensure they properly display Unicode text (i.e. any non-English/ASCII characters). On some screens, if a user entered Unicode text it might be displayed as "???". This could potentially affect the time slices, yearly load shapes, and a number of other screens.
Fixed a range error when writing NEMO data files during certain types of optimization calculations.
Fixed various other range errors.
2020.1.105: 10/30/2023
Fix to address the possibility of an erroneous error message during stock turnover calculations.
Additional error checking in MACC calculations.
2020.1.104: 10/19/2023
Fixed "Bookmarks do not match table" error message in Analysis View when selecting a new variable in situations where that variable is not defined at the current tree branch.
Fixed problems displaying social cost results in Results View where costs are calculated at multiple levels in the tree: problem particularly noticeable when showing results by branches with levels set to 2 or more.
When displaying social cost results by cost category, demand-side costs are now split up according to how those costs were specified: allowing you to separately report activity-based costs, costs of saved energy (CSE), and costs specified as a total value (reported as "Demand Other" costs). If you are using stock-turnover methods, LEAP will also separately report vehicle and other stock purchase costs.
Fixed issue where the list of valid variables was not being updated after a user edits the Dispatch Rule variable.
Fixed editing of the Transformation Process Share variable: it now only lists those branches for which the Dispatch Rule has been set to PercentShare.
Fixed incorrect resizing behavior of Tag Toolbar panel, when main screen resized.
Improved performance of the Show/Hide branches screen.
Improved handling of NEMO SQLite data files to help ensure they get properly closed in the event of an error, thus avoiding subsequent errors in which LEAP is unable to delete and overwrite those files.
Fixed various other range errors.
Fixed I/O Error 103 in calculations when Costs of Saved Energy (CSE) set to be calculated relative to base year energy use.
Temporarily removed chart type selection options in Analysis View, as these were not working correctly. An improved, easier-to-use version will return in LEAP2024.
2020.1.103: 9/1/2023
Fixed "Failed to run Julia/NEMO" error on computers where Windows user's name includes accented characters.
Improved formatting of Results view X axis when there are a large number of items to display (e.g., when showing very detailed time-slicing).
Fixed bug sometimes causing LEAP to incorrectly report that system yearly load shape load fractions do not sum to 100%.
2020.1.102: 8/13/2023
Fixed issue with some costs being displayed one level above the correct level when showing social costs.
Added support for forthcoming NEMO v2.0.
2020.1.101: 7/20/2023
Fixed error when adding a new fuel in the fuels screen as a copy of an existing fuel.
2020.1.100: 7/19/2023
Fixed problems with Results View selection boxes not showing the first item in some dimensions (e.g., types of capacity, types of output fuels, etc.)
Added checks and warnings if you select a UNC path (starting with characters "\\") as the LEAP areas folder. This naming format is not supported when running optimization calculations.
Improved UI of error messages when detecting out-of-date data in the Excel cache.
2020.1.99: 6/23/2023
Fixed bugs related to filtering of data and result variable references, and improved the Branch/Variable wizard used to select branches, variables, units and filters. Also improved error reporting when a reference has an invalid filter.
When load factors are out of allowable range, this is now reported as a diagnostic message rather than an error.
Updated help.
2020.1.98: 6/9/2023
Further fixes and optimizations to Excel caching.
Fixed problems with right axis not showing correctly when plotting a second variable in Results View.
When switching areas, the Remember View feature now works properly when switching to an area displaying gridded maps in Results View.
Fixed erroneous error message in calculations occurring when the System Load Shape variable was set to ShapeNone. LEAP was still checking the system load shape values even though they are not utilized in this configuration.
Improved migration of the Renewable Target variable from older format areas.
2020.1.97: 6/7/2023
Fixed range errors during calculation of areas using auxiliary fuels.
Fixed incorrect columns displayed when editing activity level data (numerator units columns shown twice, missing denominator units).
Fixed error message when displaying <All> or <Calculated> scenarios in the Analysis view scenarios selection box.
Further improvements and bug fixes to Excel data caching.
Improved migration of system load shapes from older format areas to new format. These shapes were previously specified for each Transformation module, but are now specified under the Load Shapes branch for each fuel.
Added new function ShapeEqualEnergy that calculates load shape with equal energy use in each time slice.
Fixed LinForecast and ExpForecast functions not working correctly when Windows has non-English regional settings.
Fixed spurious warning about tsc64.dll being out of date when Windows has non-English regional settings.
Other minor improvements and bug fixes.
2020.1.96: 6/2/2023
Fixed incorrect calculation of system load shapes in simulation calculations in situations where the shape was set to be calculated using the ShapeFromDemand method. Problem did not affect optimization calculations.
Fixed missing variable RenewableTarget at Load shape branches.
Fixed failure to display mass and volume units as appropriate when selecting a numerator unit for energy intensity variables. Also improved the operation of this selection box to highlight the currently selected unit.
Fixed error reporting, which was switched off in most recent release. Sorry!
Fixed UI problems in Script Editor. Screen contents were not being redrawn when screen was resized.
Added new result variable to show demand load shapes in energy units (as well as previous format in power units). The two variables are now named Power Load Shape and Energy Load Shape.
Updated help files
2020.1.95: 5/30/2023
Fixed range error when showing Sankey diagram in data sets where some Transformation modules hidden.
2020.1.94: 5/30/2023
Delete Multiple Regions: New option to delete multiple regions in the General: Regions screen.
Improved Results View UI when selecting a result variable: LEAP is now smarter about automatically selecting the most appropriate branch and axes to match, and less likely to show inappropriate results (e.g., results for peak power inappropriately summed across all time slices).
Fixed unit classes available to emission factors in new "enter data in another unit" feature (now mass only).
No longer attempts to restore a remembered view when an area is upgraded when it is opened, or if LEAP not closed properly.
2020.1.93: 5/26/2023
Yearly Shapes: Previously, system load-shapes were either specified on a module-by-module basis using the System Peak Load Shape variable, or they could be calculated internally based on the load shapes of each demand device. Now, load shapes are gathered together and specified for each fuel under a new top-level Load Shapes category branch that sits between the Demand and Transformation category branches in the tree. You can now specify whether load shapes are included in your analysis under the Settings: Scope & Scale screen. Specify if shapes are to be included for electricity only, for electricity, heat and natural gas, or for all fuels. You must include load shapes if you also want to include a Transformation analysis. The load shapes option on the Settings: Calculation tab has now been removed.
In the new System Load Shape variable (accessed for each fuel under the high-level Load Shapes category branch) you can specify the load shape for each fuel using standard expressions such as the YearlyShape function that lets you reference a load shape stored in the General: Yearly Shapes library, or you can use three new preset functions: ShapeFlat, indicating that every time slice has equal loads, ShapeNone, which tells LEAP to ignore variations in loads among time slices, or ShapeFromDemand, which causes LEAP to calculate the system load shape from all of the individual loads for the demand-side devices using that fuel. After you set ShapeFromDemand for a fuel, once you return back to your demand device branches, you will also see the Load Shape variable displayed for all devices using that fuel. This is the variable where you can specify the yearly load shape for each device (again, typically by using the YearlyShape function to reference a load shape stored in the General: Yearly Shapes library). One older function DefaultYearlyShape, which tells LEAP to use the first shape in the Yearly Shapes library has been renamed ShapeDefault.
This new design provides more flexibility and consistency than previously. You can now use different load shape methods for each fuel. For example, you might use demand-side calculated load shapes for electricity, and simpler exogenous system-wide load shapes for all other fuels. Load shape methods can also differ among scenarios. It also supports yearly load shapes that are entered as either a percentage of the peak load, or as a percentage of the annual energy load. LEAP now supports both formats and will internally convert shapes as needed to a common format. Previously, you were required to specify yearly shapes as a percentage of the peak load when using simulation calculations, and as a percentage of the annual energy load when using optimization calculations. Now you can freely reference shapes from the General: Yearly Shapes library regardless of how that data was originally specified. This new design also supports examining demand load shapes in Results view, even if you have chosen not to do a Transformation analysis. To do this, simply include both Demand and Load Shapes in the scope of your analysis on the Settings: Scope screen, while leaving Transformation & Resources unchecked.
Older data sets will be updated to migrate previous load shape settings to this new arrangement. The "System Load Curve" check box in the Transformation module property screens has now been removed as it is no longer relevant.
Remembering Views: When opening and closing LEAP or loading LEAP areas, LEAP can now optionally remembers your last view (analysis, results, energy balance etc.) and your last editing position (tree branch, scenario, region, variable) and automatically show that view. If you prefer to not use this feature, uncheck Remember View on the Settings: Scope & Scale screen.
Improved Caching of Excel Data: Various changes to how references to Excel data are cached to improve performance including more efficient opening/closing of Excel itself and of Excel workbooks, more efficient lookup of data in the memory cache, and improved loading/saving of the cache when opening an area. For data sets with large numbers of Excel references these changes can make the initial calculation of data sets much faster. It also results in smaller speed improvements, even after all Excel data has been cached.
Entering Data in Different Measurement Units: When entering data denominated in energy, power, cost, mass, volume, area and length units, the orange button attached to each expression in Analysis View, now includes an option to let you "Enter data in another unit.." This option lets you select a unit for data entry and then shows a dialog box where you can enter a value in that unit. Once you click OK in that dialog, LEAP will construct an expression that utilizes the ConvUnits or ConvFuelUnits functions to convert that value into the units expected for the expression. This feature can be especially useful in multi-region models, for which measurement units are set once across all regions and all scenarios and for Transformation variables where units are set for the module as a whole.
General:Units Screen: Now supports adding of fuel economy units and includes a few new default length units such as nautical miles and decameters. It also includes various UI refinements such as auto-resizing of columns, and editing of conversion factors for fuel economy units.
Mouse Cursor Handling: Now more properly shows the busy/blue circle cursor during more length operations such as opening and closing an area, changing views, and application startup.
Growth and End Year Dialog Boxes (accessed when clicking the orange button attached to each expression in Analysis View). These now include a drop down calculator tool that you can use to do quick calculations before entering a value).
Improved Plotting of the Second Variable in Results View: to better support plotting GHG emissions target lines on same axis as GHG projections.
Improved Speed of UI and calculations.
Updated Help: to reflect above changes.
2020.1.91: 3/30/2023
Fixed missing index in Summary Reports database table.
Minor UI improvements in Customize Palettes screen.
2020.1.90: 3/29/2023
User-Customizable Color Palettes: Color palettes are now stored in the _Settings\Palettes folder as .pal files. You can also place them in your LEAP area folders. Any named palettes in an area folder take precedence over similarly named palettes in the _Settings\Palettes folder. Thus, you can distribute customized color palettes along with your area and use them (for example) in favorite charts. ".Pal" files are text files that can easily be edited by hand, or you can create them from within LEAP by going to the "Customize Palettes" option accessed from the Color Palette menu on the Chart toolbar in the Analysis and Results views. From there, you can select among existing palettes and then add, edit, reorder and delete colors or adjust the luminance, hue and saturation of the entire palette. You can save the palettes you've created to .pal files either in the current area folder or in the _Settings\Palettes folder. If you ever need to reset LEAP to use the default set of palettes, just delete the _Settings\Palettes folder and LEAP will recreate it next time it restarts. Please see this Readme file for information on the format of .pal files, which support specifying colors by name, as hex and integer values, or in RGB, CMYK and as internet-style hashed hex codes (e.g. #ff6347). We've also added a couple of additional palettes as examples, and for more, here is a useful resource website with palettes that can easily be saved as .pal files. Thanks to Tommaso Ficara for this enhancement suggestion!
LEAP Favorite Charts now include a color palette. In the Overviews screen, each chart is now plotted with its own particular palette. However, you can use the Color Palette menu on the Overviews chart toolbar to use a single palette when plotting all charts in an overview.
Improved Summaries View: Fixed multiple bugs and improved options for editing headings and reordering rows in summary reports.
Fixed "data set not in edit mode" error when editing transport stock-turnover data.
2020.1.89: 3/19/2023
Improved caching of Excel data and faster speed of access to linked Excel data. Now avoids continuously opening and closing of Excel.
2020.1.88: 3/18/2023
Improved speed of calculations for data sets with complex expression referencing. Some large data sets now calculate in 25% less time.
Improved the Insert Branches from Folder function. In some situations, this was not correctly remapping newly-added fuels and other data structures when importing data from one area to another.
Improved error messages when expressions reference a deleted branch. Now shows ID of missing branch.
Improved the RegisterLEAP.bat batch file found in the "Program Files\LEAP" folder, which can be used to register LEAP and its tsc64.dll component. You can now use it directly from the Windows File Explore by right-clicking on it and selecting "Run as administrator". The batch file should now work regardless of what is the active directory, and will warn you if you try to run it without full administrative rights.
Recompiled with Delphi 11.3.
2020.1.87: 3/5/2023
Cloud Services Check: Added test to see if the LEAP Areas folder is being synchronized to various common cloud services such as OneDrive, Google Drive, Dropbox, Adobe Creative Cloud, Apple iCloud Drive, and Box. Cloud services sometimes prevent LEAP from accessing the files it needs to operate correctly, and some users have been experiencing such errors. If this situation is detected, LEAP will now warn the user and advise them to relocate their LEAP Areas folder to another location. Use the Settings:Folders screen to choose another location for the LEAP Areas folder.
Fixed bug in "Create Branches/Update from Excel" wizard causing a range error when processing imported tags. Also made the wizard more robust if numbers in Excel are formatted with thousand separators, and to better handle non-English formatting.
Fixed bug that could cause some rows in the main data entry table to be hidden when clicking on a parent branch in the tree (e.g., for the Fuel Shares variable). Improved triggering of chart refresh to make main data entry table more responsive.
Added additional error checking for invalid branch/variable references, that could cause errors during calculations.
Tightened name checking for branches and user-added variables. LEAP now checks to make sure that these names do not contain the names of predefined constants. In rare circumstances, you may have to adjust some branch names as a result of this change.
2020.1.86: 2/20/2023
Improved Create/Update Branches from Excel Wizard (now renamed "Create Branches/Update Data From Excel"): This wizard now supports importing of user variables and does a better job of handling units and scaling factors, making it more useful for both Demand and Transformation analysis. It has also been made more flexible, supporting ranges of data in Excel both with and (now) without header labels. It now also supports importing data either as simple values extracted from the Excel sheet, or as an expression that links back to the original sheet (so that LEAP's values will thereafter be automatically updated as the sheet is edited). The wizard's user interface has also been improved. It now notes which branches will be added, and which will have their data updated. Finally, the wizard can now be launched by simply copying a range in an Excel sheet (Ctrl+C), and then selecting Edit:Paste in LEAP (Ctrl+V).
Improved Time-Series Wizard: If you have copied a range of time series data onto the clipboard in Excel, the Time-Series Wizard will now pre-fill the sheet and range selection boxes in the Wizard with the relevant information from the data copied from spreadsheet.
Support for Excel Files located on Networks and the Internet. Added support for linking to Excel ranges stored on the internet (i.e., at an HTTP URL address and starting with the "http://" or "https://" format) or file names specified on network drives using the UNC naming convention (e.g., with the "\\servername\" format).
Improved the Main Data Entry Table UI: Previously, a read-only column in the table showed the base year value for each branch/variable while editing that variable's expression. This extra column appeared only when editing scenarios. Now, you can show this column both while editing Current Accounts and scenarios. In data sets with multi-year Current Accounts data, you can also optionally show an extra column with values for the last historical year. Decimal places displayed in these two columns are now displayed to match those in the summary table below the data entry table. Use the increase/decrease decimals button to adjust the number of decimals displayed. You can also now optionally show or hide these two columns using the popup menu reached by right-clicking on the main data entry table. Note that the values displayed in these two columns are not directly editable: they are calculated based on the expressions entered for Current Accounts.
Improved the "Ditto" (Ctrl+D) functionality in the main data editing table: This is used to copy the value of a field from the record immediately above. Previously, using Ditto on fields with selection boxes, caused those selection box to pop up, interrupting repeated use of the function.
Fixed the User Variable Properties screen, which was not allowing default Current Accounts or Scenario expressions containing references to other variables without a specific branch reference. Also, a small improvement to the User Variables properties screen to let you quickly set the visibility of a variable to either the current branch or to a selected branch.
Fixed range errors during calculations immediately after deleting certain modules in multi-region areas.
Fixed a range error when attempting to set up time slices to have 8760 hourly time slices in the General: Time Slices: Setup screen. Note: we still do not recommend using this setting. It will lead to very slow calculations and in most cases will require more memory than most PCs have available.
Fixed incorrect emissions calculations for certain transformation module auxiliary fuel use when the module is not set to "Meet auxiliary fuel use from this module's output (where possible)".
2020.1.85: 12/29/2022
Fixed problems with "Insert Branches from Other Area", which was failing to import units and scaling factors.
Fixed conversion factor problems in variables referencing results variables.
Improved display of units for Indicator variables in Results view.
Fixed occasional range error when deleting indicator variables.
2020.1.84: 11/22/2022
Fixed error when referencing or accessing user variables set to be visible at all demand branches (error caused by 2020.1.83 - apologies!).
2020.1.83: 11/19/2022
Fixed range errors occurring when trying to add or delete branches, that were triggered if the user was in the middle of editing of an expression. Tree editing options are now disabled while editing an expression.
Added length class units such as miles, kms, etc. as options for demand activity data.
Fixed various problems during importing of hourly load shapes (not properly importing availability shapes, not working correctly when using non-english number formatting).
Fixed repeated screen refresh (flashing screen) when editing Historical Production or Exogenous Capacity data if the lower chart/table/notes pane was hidden.
Added additional checks for circular expression references during parsing of expressions.
Added additional checking for expressions referencing variables at branches that are hidden in one or more regions. Such references will generate errors in calculations.
Fixed error when adding a new Transformation branch in cases where user variables have been created that are associated with multiple levels of Transformation branches.
Fixed display problem causing Load Shape records to not be displayed when clicking on certain branches.
Fixed incorrect calculation of emissions in auxiliary fuel calculations when module is set to meet auxiliary fuel use from module's own output where possible.
Fixed incorrect units & scaling factors in expressions referencing auxiliary fuel use.
Fixed incorrect calculation of expressions referencing result variables (e.g. pollutant loadings) in cases where the unit in the expression reference does not match the default unit for the result.
Fixed fuel economy calculations in situations where a vehicle technology had multiple fuels (e.g., for plug-in hybrids). Results are are now shown weighted across the results for all fuels.
Renamed the demand "mileage" result variable as "vehicle distance", to show the total annual distance driven of all vehicles at a given branch. Also added two new result variables to show the average annual distance driven per vehicle for newly added vehicles and for the average on-road stock of vehicles. These are named "New Vehicle Mileage" and "Stock Average Vehicle Mileage" respectively (all found within the Demand result variable category).
Improved Transformation calculations to better handle situations where no load curve is specified for a module. LEAP now assumes demand in each time slice is simply proportional to the number of hours in each time slice.
Improved checking of input data during Transformation calculations. In particular, LEAP no longer checks input data for branches if those branches are hidden. This was slowing calculations and could also cause error messages related to unused/hidden parts of a model.
Improved how the optional second variable is plotted in Results View when the legend is set to show multiple scenarios. The charts now shows separate lines for each calculated scenario. Also added an option to plot the second variable on the same axis as the first variable in cases where both variables have the same units.
Improved calculation of primary products and by-products in Transformation modules with more than one output fuel. LEAP was incorrectly calculating these amounts if the demand for a primary product dropped to zero but the demand for by-products was non zero.
Added new result variable to show "Peak Power Requirements" on a module in each time slice. Previously only the annual maximum peak power requirements were reported. The previous result variable has been renamed "Maximum Peak Power Requirements".
Fixed error message when exiting Manage Areas screen.
Further behind-the-scenes changes in preparation for new language translations (stay tuned!).
2020.1.81: 10/07/2022
Fixed bugs when editing lifecycle profiles in multi-region areas. Now properly shows profiles that inherit across regions. Also now shows standard color coding on profile names to indicate if they are explicitly entered (blue), or inherited from another region (green). This is the same color coding as used for expressions.
Fixed bug when accessing versions from the API. The version numbering in the API was reversed versus the order in LEAP itself.
Added the ability to delete a version via the API (syntax is LEAP.Versions.Delete(VersionNum) or LEAP.Versions.Delete("Version Name")
Fixed options for fine-tuning the location of the chart legend in the Chart Export dialog screen.
Improved the caching of Excel data sets. In some cases, LEAP was incorrectly reporting that cached spreadsheets had been changed since they were cached.
Python and Other Scripting Languages: As Microsoft has stopped supporting the MSScript.OCX package used for scripting in LEAP, it is becoming harder to support multiple language scripting within LEAP. We will continue to support VBScript (i.e. Basic) as long as we can, but we have decided to remove support for the Perl, PHP and TCL languages. For the Python language, we have also removed support via MSScript.OCX, but given its growing popularity, we have added support for it via a new set of components. To use Python within LEAP's Script Editor screen, you will first need to install Python for Windows from ( www.python.org) . At the time of writing, the latest version was 3.10.7. We strongly recommend using Python v3.10 or later. Make sure you install a version of Python (32-bit) or (64-bit) that matches the version of LEAP you installed. Before running LEAP, you should also install the pywin32 package into Python by opening a command window and issuing command pip install pywin32. When running scripts in the LEAP script editor you can also access the LEAP object, which is implicitly available to Python in the Script editor. Using Python in the script editor is still an experimental feature, so may still be buggy. For example, we have not yet got the code completion features fully working when editing Python source code. We also have not yet added support for Python when using LEAP's events or Call function.
Further under-the-hood changes to prepare for future improvements to LEAP's language translations.
2020.1.80: 9/27/2022
Fixed bug: LEAP not properly recognizing heat rate numerator/denominator units in Transformation modules.
2020.1.79: 9/26/2022
Removed duplicate data file from LEAP dictionary to reduce size of installation files. Otherwise same as 2020.1.78.
2020.1.78: 9/26/2022
Updated LEAP to work with NEMO v1.9. NEMO v1.9 includes various optimizations for significantly faster calculations including support for JuMP's direct mode and bridging features, and microarchitecture-specific optimizations that can reduce NEMO's start-up and calculation time. NEMO v1.9 also supports a new open source solver (HiGHS), which is installed by default alongside the GLPK and Cbc solvers. In all, LEAP and NEMO now support the following solvers: Cbc, GLPK, HiGHS, CPLEX, Gurobi, MOSEK, and XPRESS. More information on NEMO v1.9 here.
Updated IBC (The Integrated Benefits Calculator): Now contains data for 76 new countries for a total of 163 - covering most of the larger and more populous countries worldwide and, for the first time, including most countries in Europe, North America, Central Asia, the Middle East, and Oceania. The newly added countries are: AFG, ALB, ARM, AUS, AUT, BEL, BIH, BRN, BGR, BDI, HRV, CYP, CZE, DEU, DNK, EGY, ESP, ETH, FIN, FRA, GBR, GEO, GRC, GTM, GIN, GNB, GUY, HTI, HND, HUN, ISL, IRN, IRL, IRQ, ITA, JPN, KAZ, KWT, KGZ, LAO, LBN, LKA, LVA, LTU, MKD, MDA, MNE, NLD, NZL, NIC, NOR, PAK, PAN, POL, PRT, ROU, RUS, SAU, SGP, SLV, SVK, SRB, SVN, SUR, SWE, CHE, SYR, TWN, TJK, TUR, TKM, UKR, USA, UZB, YEM. This update now also supports two alternative health impact relative risk functions, corresponding to the functions used in the 2010 and 2015 versions of Global Burden of Disease studies.
Improved Energy Balance Reports: Now supports showing sub-groups of fuels and sub groups of regions when relevant columns are chosen. Also improved the user interface for selection of columns, fuels, regions, etc: making it easier to use and more consistent with the Results View.
Improved Versioning: You can now choose whether or not to include results within saved versions of an area. Doing so, means results of saved versions will be immediately available (without the need to recalculate an area). Not doing so, keeps the size of backed-up versions smaller. When creating a new version use the new "Save Results with Version?" check box to choose.
Fixes a bug causing LEAP with NEMO to not respect renewable energy targets.
Fixes bugs in auxiliary fuel energy and emission calculations when multiple processes are used in a module.
Fixes various bugs causing user interface crashes including various range errors and the "GridTable: Bookmarks do not match table" error.
Bug fixes and UI improvements in Results view to better handle groups of tags used for displaying results.
Under the hood changes to prepare for future improvements to LEAP's language translations (stay tuned).
2020.1.77: Not released.
2020.1.76: 8/21/2022
Improved reporting in situations when sufficient capacity cannot be built in optimization calculations (due to over-specified constraints). You can now choose from three options: (1) Stopping calculations and reporting an error in LEAP (the default), (2) Continuing calculations and reporting a warning diagnostic message, and (3) Stopping calculations and reporting an "infeasible solution" error in NEMO or OseMOSYS. Option 3 is less user-friendly, but provides more detailed information. Past versions of LEAP always reported a (perhaps too-easily-overlooked) warning diagnostic message, so you may find that you now see error messages when previously you did not.
Fixed problem introduced in v74 that could cause results to appear to be blank at some branches (e.g. in Non-Energy sector branches). Due to the severity of this problem, we strongly recommend updating to the latest version. Sincere apologies for this one!
Further fix to auxiliary fuel calculations for cases where auxiliary fuels are set to be met from a module's own output fuels where possible.
Fixed bug that could cause an optimized Transformation module to be calculated, even if it was marked as hidden. Also added a new test to check that module's marked as optimized are visible across all calculated regions.
Added additional checks for invalid scenario inheritance structures when loading an area.
Faster Downloads: Aside from the above changes to LEAP, we've also started using a new Content Delivery Network (CDN) to provide faster downloads of LEAP and NEMO. The CDN caches LEAP's setup files on servers around the globe, making for faster access than when getting them directly from our server in the US. We chose a CDN optimized for users based in Africa, Asia and Latin America. With this new CDN, download times are reduced on average by about 50% (often even more). We hope this makes it easier for you to access and update LEAP.
2020.1.74: 8/14/2022
Fixed various bugs (e.g. range error when adding a branch).
Added new composite result dimension (years & effects).
Improved checking of results dimensions when using composite dimensions.
Improved checking/automatic renaming of branches when adding multiple feedstock fuels, auxiliary fuels, effects to help ensure neighboring branches do not have the same name.
Improved ordering of lists of fuels, effects, scenarios, regions etc. (e.g. in Results View selection boxes). By default, these use the default ordering for each data dimension. You can also click the "alphabetical" check box to alphabetize listings. Results View selection boxes also now include both the names and abbreviations for effects, regions and scenarios.
2020.1.73: 8/7/2022
Optimized Loading of Areas: Most areas now open in 20%-40% less time.
Updated file format: reduces file sizes and in most cases increases speed of operations. The one-time process of converting from the older file formats may take a few minutes per area. Please be patient with LEAP - future updates will be much faster. Thanks!
Improvements to Analysis View Data Entry UI: Columns in the data table are now auto-sized to provide more room for editing expressions. Analysis View is also now more configurable. By right-clicking on the data table, you can select various new options as follows:
Auto-Adjust Splitter Position: use this to control whether the lower chart/table/notes panel is automatically resized as the number of rows in the top data entry table changes. In past versions of LEAP it always resized. Leave this unchecked to control the splitter position yourself.
Expand Expressions Column: In past versions of LEAP, the expressions column always expanded to take up as much width as possible. On wider screens, this made reading the table more difficult. Uncheck this option to have LEAP autosize the column to use only as much space as required depending on the displayed expressions. In both cases, all other columns now all autosize.
Variable Tabs: Combined two previous options into a new "Variable Tabs" option. This lets you control how variables are displayed on screen in the Analysis View. Select among the following options: single line (default), multiline, or none. If you choose none, you can select variables using the Variable selection box. In general, we recommend using a single line of tabs to maximize readability. However, some may prefer the older multiline display, which differs only when there is a large number of tabs.
In addition to these new options, you can also use the Chart/Table/Notes option to show or hide the entire lower pane in Analysis View. All these settings are application-wide, and remembered across LEAP sessions.
Improved Responsiveness: The chart/table/notes panes in the lower half of the Analysis View are now updated only when you stop scrolling within the tree or the data table (after a delay of about half a second). This improves the responsiveness and editing experience when using the top table.
Fixed Display Problem in Analysis View Data Table: Table was not properly resizing to fit within its surrounding area, especially when switching among variable tabs. Also fixed similar problem in General:Regions screen.
Load Factors Error Message: Fixed erroneous error message about Load Factors being out of allowable range.
Revised Auxiliary Fuel Calculations: Better accounts for situations where auxiliary fuels in a module either do or do not come from the fuels produced within that same module. Also fixed a bug whereby auxiliary fuel calculations were not triggered unless a module included capacity data.
Improved Error Checking and Diagnostics in Transformation Calculations: When using the PercentShare dispatch rule in all process in a module, LEAP was not checking to ensure that process shares summed to 100%. In some cases you may wish to use different dispatch rules for different processes in one module, so this new error check only occurs if all processes in a module are using the PercentShare dispatch rule in simulated years.
Improved error checking of expressions: LEAP was allowing some infeasible expressions to be entered (e.g. referring to a result variable before that variable had been calculated). Have also improved the integrated debugging features, which in some cases were not returning the user correctly to the location of an error.
Other minor UI improvements such as autosizing of columns in fuels, regions, effects and tabs screens and additional presets for expressions when using the orange "E" button attached to each expression.
Various other minor UI improvements and bug fixes.
2020.1.71: 7/25/2022
Fixed issue detecting Julia version on PCs with non-English number formatting.
Fixed issue with yearly load shapes for demand devices not being displayed in Analysis view when clicking on lowest (technology) branches in tree.
2020.1.70: 7/24/2022
Improved error checking when loading favorite charts.
Fixed range error in Transformation calculations for some areas.
Fixed erroneous error message "Load Factor must be between 0% and 100%" in Transformation modules without load shapes.
2020.1.69: 7/22/2022
Further update to address "Field HasLoadShape not found" error. Previous attempts at fix did not work. Apologies for the problems.
2020.1.68: 7/21/2022
Further improvements for drawing charts showing environmental effects in physical units. Now supports multiple selected effects in the legend if they share the same class units.
Fixed chart drawing error in Results view introduced in v67.
Improved alignment of chart legends and improved chart exporting including better default legend position.
Now correctly remembers chart grid and border settings between sessions and when loading favorites.
2020.1.67: 7/19/2022
Added ability to set different shaded borders on Results View bar charts. Select this using the new Borders option on the Chart toolbar.
Fixed occasional error when showing results for environmental effects in physical units.
Update to correct NEMO's connection to the GUROBI and GLPK solvers - problem that arose when NEMO moved to the newer version of Julia.
Improved speed while checking and updating tables when the file format changes.
Improved reliability of "Insert Branches from Folder" feature - with better checking of source areas.
Fixed optimization calculations when models have two or more storage technologies.
2020.1.66 7/7/2022
Improved Results View charts and tables: These now show results more consistently. Previously, entirely blank rows (legend series) were removed. This led to chart series changing color from year to year, making results interpretation more difficult. By default, all rows (series) are now displayed - even if entirely blank. You can still opt to hide blank series in charts and tables using the Advanced: Hide Blank Series option on the Results View Chart Toolbar.
Improved YearlyShapes screen: This now shows the annual average load factor of a shape as a value at the foot of the screen, and also plots that value as an extra line on charts where appropriate (for peak load and availability type load shapes). In addition, using the new "Show as" selection box, yearly shape charts can be shown as either "Percent of Peak" or "Percent of Energy", independently of how the data is entered. Finally, the Export to Excel feature has been improved. It now exports both hours and shape values.
Faster optimization calculations: In past versions, any edits to data caused all optimization-based scenarios to be recalculated. LEAP now properly recalculates only scenarios affected by edits.
Support for NEMO v1.8. Updating to NEMO v1.8 is recommended but LEAP also still supports NEMO v1.7. NEMO 1.8 has the same functionality as v1.7, but has been updated to use the latest versions of the Julia and JuMP platforms, as a foundation for future development. It also supports the latest versions of the Gurobi, CPLEX and XPress solvers. Please uninstall older versions of NEMO before installing NEMO v1.8
Land area-based environmental effects: Improved reporting of environmental effects to support indicators measured in units other than mass or volume (e.g., land area or injuries). LEAP now supports showing environmental effect results in different units when the effect is defined in mass, volume, or area units.
Background images: Improved Results View reports with new options for setting filtered background images on charts and improved sizing and rendering for chart labels.
Fixed bug in Transformation calculations that could affect Transformation Output results when "Meet auxiliary fuel use from module outputs" was enabled.
Fixed bug causing the Results View Load Factor and Peak Power Requirements values to sometimes be calculated incorrectly depending on the type of load shape and calculation methodology chosen.
Fixed issue where adding a new branch could break references among immediately neighboring branches in expressions.
Fixed the Area: Install: Install from Internet menu option. This feature allows you to download sample LEAP data sets from SEI's servers. It had recently stopped working due to changes on the server.
Fixed Analysis View table becoming grayed out when script editor was open.
Fixed range errors occurring after adding or deleting some types of tree branches.
Various other fixes and UI improvements to make LEAP easier to use and more robust.
2020.1.64: 5/26/2022
Fixed range errors when using forecasting functions (apologies - problem introduced in v63).
Fixed exporting of Life Cycle Profiles and improved formatting of exported values in Excel.
Various other minor UI improvements and bug fixes (e.g. when deleting multiple branches).
2020.1.63: 5/13/2022
Fixed bug in LEAP data caching.
2020.1.62: 5/12/2022
Fixed errors when navigating tree branches stating that grid is not in edit mode (problem introduced in v59 - apologies).
Further refinement to UI related to display of variables as tabs.
2020.1.61: 5/2/2022
Fixed Selected Branches screen in Results View, which was not working properly with multi-region areas.
Fixed occasional access violation errors in Results view when mouse cursor hovered over some bar charts.
2020.1.60: 4/28/2022
Improvements to Scripting: Thanks to great efforts from the developer of the tsc64.dll component (Thanks Gaku!), we've finally been able to get the error reporting working in scripts in the 64-bit version of LEAP (up to now it worked only in the 32-bit version). We've also used this opportunity to improve the information reported in the Edit Scripts screen, when a script error occurs, to fine tune placement of the edit cursor after an error and to have error information added to the print window. These changes improve the overall debugging experience. We've also improved LEAP so it will now detect if an older version of tsc64.dll is registered. If so LEAP will automatically register the required new version (1.2.5.2 or later).
Improved optimization calculations: LEAP now quickly checks that the requested optimization framework and solver exist at the start of the whole calculation process. This avoids wasting time in cases where a solver is requested that is not installed or available.
Fixed drawing of line charts (problem introduced in last version).
Improved checking for the functions.vbs file used in LEAP Call expressions.
2020.1.59 4/19/2022
Fixed rare endless looping condition when attempting to show some charts in Results View.
Improvements to wedge charts including better display of reference line, better legend ordering and interactive highlighting of series when hovering over chart legend items.
Fixed issues related to installing areas (backed-up versions were not properly installed).
Fixed issues related to use of backing up and restoring versions via the API.
Fixed various range error bugs (e.g. when deleting tree branches).
2020.1.58 4/12/2022
Fixes range error when adding a Transformation process in cases where user variables defined at those processes.
Fixes problems with word processing/documentation features, including failure to load first branch's notes when opening LEAP.
Behind the scenes: updated to a newer development environment (Delphi 11.1).
2020.1.57 3/17/2022
Fixed LEAP-WEAP linkage. To use LEAP and WEAP together, you must use the 32-bit version of LEAP, since WEAP is a 32-bit-only application.
Updated LEAP to work with the next release of NEMO (v1.7.0). Highlights of NEMO 1.7 include improved multi-threading for up to 25% faster calculations on small- and medium-size data sets, support for multi-user installations, better handling of renewable targets, and bug fixes.
Improved Results View behavior when attempting to show charts for a selection that contains no values. LEAP now properly displays chart titles and indicates that no results exist.
If they are installed, NEMO and the Cbc solver are now used as the default optimizing framework and solver. This corresponds to setting the "Optimize" variable at a Transformation module to "Yes". Previously, this setting indicated using OSeMOSYS with the GLPK solver. If NEMO is not installed, LEAP will continue to default to OSeMOSYS plus GLPK.
Improved error reporting when stock shares <> 100%. LEAP was reporting errors one level up from where they occurred. Sorry for the confusion caused!
Experimental adjustments to the LEAP setup program to support installation on non-Intel CPUs (e.g., Windows for ARM on Apple M1 Macs via Parallels).
Fixed problems preventing selection of appropriate units for emissions constraints and externality cost variables.
Fixed parsing of some expressions containing numbers written in exponential format such as "1.23E+4".
Fixed Transformation dispatch problems when the "Meet auxiliary fuel use from module outputs" option was enabled.
Fixed various range and access violation errors for greater stability.
Refined display of the footers on data editing tables for a cleaner/less distracting display.
Fixed minor cosmetic issues on the high-resolution LEAP application icon.
Behind the scenes: updated to a newer development environment (Delphi 11).
2020.1.56: 1/4/2022
Improved display of regions in Analysis View. Regions now properly listed in the same order established in the General:Regions screen.
Improved responsiveness of Analysis View when selecting among regions.
Added new keyboard shortcuts to select previous and next regions, scenarios and variables in Analysis View as follows:
Alt-R: Next Region
Shift-Alt-R: Previous Region
Alt-S: Next Scenario (previously, Alt-S would open the settings screen)
Shift-Alt-S: Previous Scenario
Alt-V: Next Variable
Shift-Alt-V: Previous Variable
Bug fix: TotalChildren and other similar functions that work across multiple branches were not honoring the specified units in the expression.
Improved TotalChildren function to now also support an optional year parameter. E.g. TotalChildren(Branch:Variable, year)
2020.1.55: 12/13/2021
Fixed problems with expressions linked to Excel, where LEAP reported the linked spreadsheet was not found.
Various fixes and refinements to the Time-Series wizard when linking to Excel files. Improvements include better selection of default folders in the Excel spreadsheet selection dialog; the addition of an automatically generated comment in expressions when importing as data, which notes the original source spreadsheet and range; and better default formatting of data using fixed numbers of decimal places. Right-click in the wizard to adjust the number of decimals. We've also improved how LEAP opens/closes Excel to get linked data, so there is less frequent visual switching between LEAP and Excel.
2020.1.54: 11/19/2021
On startup, LEAP now checks for and (if necessary) registers file TSC64.DLL. This is required for scripting in the 64-bit version of LEAP. Also updated LEAP to include the latest version of TSC64.DLL (v1.2.4).
Further improvements, fixes, and speed-ups for displaying map-gradient and map-bar charts in Results View.
Fixed bug: externality costs not being applied to demand branches using Transport Stock Turnover methods.
UI Improvements when selecting map shape files and images in the Settings screen.
Improved grouping of smaller series in legend (now also works for fuels and emissions as well as branches).
2020.1.52: 11/10/2021
Bug fixes/optimizations when showing gradient maps in Results View. Still working to improve speed of mapping. Thanks for your patience!
2020.1.51: 11/02/2021
Further improvements for showing composite dimensions on the X axis of Results View charts.
Adds Years & Fuels as a new composite dimension (in addition to previous Years & Scenarios, Years & Regions, Years & Branches composite dimensions)
Now supports showing groups of fuels and groups of regions in composite dimensions (as well as individual fuels/regions).
New option to select all or selected items from the second dimension of a composite dimension. This is set with an additional button shown next to the X axis dimension menu.
New option to set which dimension shown first: either years or scenarios/regions/fuels/branches. This is set with the Years First check box shown next to the second dimension menu.
Better spacing between groups of bars in composite charts.
Bug fixes to make drawing of charts with composite dimensions more reliable.
2020.1.50: 10/29/2021
Fix for "BatchTable: Table does not exist" error that some people were experiencing in Results View after the recent updates.
2020.1.49: 10/26/2021
Fixed problem that sometimes caused scenarios to be unnecessarily recalculated: triggered by switching between areas.
Fixes to code for inserting branches into an area from another area. In some circumstances, doing this could corrupt existing expressions that referenced pre-existing branches and variables.
Fixed units display in Results View screen when showing the Total Activity data variable.
Fixed error message when using Save while editing the Transformation\Endogenous Capacity variable.
Improved reliability of multi-region mapping.
2020.1.48: 10/14/2021
Fixes bug in how LEAP handled capacity additions calculated in NEMO (bug introduced in v44 on 9/27). If you are using LEAP 2020 vs 44-47 with NEMO, please make sure to get this fix as it affects calculation results. Apologies for the problems caused.
2020.1.47: 10/13/2021
Further fixes for display issues in Results View, especially when viewing indicators.
Improvements to checking of tree structure when running IBC.
2020.1.46: 10/05/2021
Fixed calculation of unmet export targets, which led to surplus production being erroneusly reported in energy balances. Unmet export requirements are no longer assumed to be passed on to subsequent (lower down) Transformation modules. Instead, they are reported via a warning diagnostic message and then set to zero. Only unmet domestic requirements are passed down to later modules.
Fixed problem displaying Overviews view (problem introduced in v2020.1.44).
- Fixed problem displaying Transformation module costs and demand category costs. Divided reporting of demand costs into two groups: category costs and technology costs.
Fixed problem with resizing and positioning the title and row/legend selection buttons in Results View when viewing tables.
Fixed calculation of growth rate format reports in Results View when results calculated every two or more years.
Removed ability to select unsupported cumulative value reports when results calculated every two or more years in Results View.
Other minor improvements to Results View diagnostic messages.
2020.1.45: 9/30/2021
Minor cosmetic fixes to Results View following recent update.
Fixed a long-standing issue with expression scenario inheritance in data sets with complex scenario inheritance patterns. Specifically, expressions in scenarios that are a combination of mini-scenarios (i.e. including the list of Additional Scenarios on the Scenario Manager screen), were not picking up the expressions in those additional scenarios if those expressions were themselves inherited from another scenario. Thanks to Juan Correa Laguna for spotting this!
2020.1.44: 9/27/2021
Updated Results View to make it faster, more capable, and easier to use. Changes include:
Faster: Results from large data sets now display much faster vs. previous versions. For example, a chart showing 5-yearly GHG emissions results for 1990-2050 aggregated across 50-countries in a continental-scale data set, previously took 39 seconds to display, but now takes less than 3 seconds: a factor of 13 improvement. Charts in smaller data sets continue to display almost instantaneously.
Show a Second Variable on a Second Axis: A second variable can now be selected using the new Second Variable button in Results view. It appears as a single series of data (typically a line plot) for a selected branch and variable and is associated with a second chart axis shown on the right side of the chart. Both data and results variables can be charted, and both the primary and secondary variables are plotted on the same X axis of the chart. The secondary variable does not currently appear in Results tables. Here's an example:
Composite Dimensions for Richer Charting Information: LEAP now let's you combine two standard dimensions into a single composite dimension for display in Results view charts. The currently supported composite dimensions are Years & Scenarios, Years & Branches, and Years & Regions. This capability allows an extra dimension of data to appear in each chart. Here's an example:
Show Results for Groups of Regions or Groups of Fuels: For example, you might show the total demand for all oil products (in a data set containing individual results for LPG, gasoline, diesel, kerosene, etc.), or you might display results for all of a region group named East Africa in a data set with national-scale results for Africa. You can display results for any named groups of regions defined in the Region Groups screen or any named groups of fuels as defined in the Fuel Groups screen. Groups appear as an extra choice in the fuel and region sub menus in Results view.
Grouped & Stacked Display of Fuels and Regions: In addition to showing individual regions and fuels, and named groups of regions and fuels, you can now also show individual fuels or regions organized into separate stacked groups. Use the Region Grouping and Fuel Grouping menu to select among these three options. Example below:
Improved Comparisons: In addition to showing differences, avoided values and wedge charts for one scenario versus another, you can now also show differences and avoided values between regions in multi-regional data sets.
Easier to Use: Multiple grouping and comparison controls have been replaced with single pull-down menus, which makes selection easier, and which better summarizes on-screen the options chosen. The chart legend font now scales with the font size set for the main tree.
Quality improvements: Fixed bug when showing differences vs. previous year values. Also now supports a greater combination of formats/comparisons.
Fixed bug in handling of pre-existing capacity data when using optimization modeling with OSeMOSYS. This problem was not present when using NEMO.
Adjusted optimization exercise data set to reflect how OSeMOSYS and NEMO handle discounting differently.
LEAP now supports stock-turnover modeling in situations where results are calculated only every 2 or more years. Previously, this type of modeling had required results to be calculated annually.
 Plotted in a Results View chart for energy demand.)
 on the X axis (a composite dimension). It also plots the energy consumption avoided in the mitigation versus baseline scenarios.)
.)
2020.1.43: 8/13/2021
Fixed calculation bug in recently updated auxiliary fuel calculations (see below).
LEAP was not honoring values set in the Import Target variable. Fixed now.
Improved checking of units and lifecycle profiles when doing stock turnover calculations. Invalid profiles and/or units will now be properly flagged in the integrated debugging system.
Improved integrated debugging. After an error, Analysis View is now more adept at highlighting the place where the error occurred, both in the tree and by positioning the cursor in the data entry table on the right-hand-side of the screen.
Added a new function "StopMarker": Use this function to force calculations to stop. LEAP will display an error containing an optional message, and then show the Analysis View screen and the branch, variable, scenario and region where the StopMarker function was entered. Use this function to create temporary debugging bookmarks.
2020.1.42: not released.
2020.1.41: 8/7/2021
Bug fix: fixed crash when attempting to show energy balance reports by year when no scenarios are defined.
Fixed missing Global Warming Potential Values for HFC-32.
Improvements to Auxiliary Fuel Use Calculations and Visualization: You can now specify that auxiliary fuels are produced and consumed internally within a process (i.e. own use). This option had previously been a global switch for an entire LEAP area but can now be set on a module-by-module basis using the Module Properties screen. We have also improved visualization of own use/auxiliary fuel use by improving the Outputs by Output Fuel and Inputs reports in Results View. Finally, the auxiliary fuel use calculations have been revamped to address problems in how own use energy flows were calculated. More information here.
Updated help files/user manual to reflect changes.
Details on Improvements to Auxiliary Fuel Use:
To allow a module's processes to take auxiliary fuels from its own outputs, you will need to switch on the option marked Meet auxiliary fuel use from this module's outputs (where possible), located in each Transformation Module's Properties screen. By default, LEAP assumes that auxiliary fuels are supplied by transformation modules located lower down in the tree, or ultimately by imports.
A few points to consider when enabling this option:
If a module's outputs are insufficient to meet the module's auxiliary fuel needs, LEAP will attempt to meet any remaining requirements for the auxiliary fuels from lower down Transformation modules or from imports.
Any emission factors applied to auxiliary fuel use will be applied to all of the auxiliary fuel use - including fuels produced internally in the module and fuels coming from lower down modules or imports.
When using this option, note that any "own use" of fuels will not be apparent in LEAP's energy balance reports since the fuels are considered to be internal to a process. However, you can use the newly revised Outputs by Output Fuel and Inputs reports in Results View to get information about own use in processes. Use the Input Type and Output Type dimensions to see information about how outputs are split between production for auxiliary fuel use and net production and how inputs are split among feedstock fuels, auxiliary fuels coming from outputs, and auxiliary fuels coming from other modules (or inputs).
Note also that it may be quite common for an auxiliary fuel to be consumed in one module but produced only by a higher up module. For example, an oil refinery module may consume electricity, which is produced only by an electricity generation module that is higher up in the tree. If so, the system will need to iterate its calculations to ensure that the extra needs of the lower down modules are met by additional production in the higher up modules. Refer to the user manual pages describing Calculation of Systems with Feedback Flows for more information.
2020.1.40: 8/2/2021
API: Additional improvements to make calls to collections of objects work more reliably and consistently. Documentation also improved.
Error reporting: the error reporting system was accidentally switched off in the last few releases. Apologies! Re-enabled now.
Reduced excessive warnings during Transformation calculations related to Historical Production.
2020.1.39: 7/31/2021
64-Bit version: Fixed rounding issue affecting accuracy beyond 7th significant figure. Issue did not affect the 32-bit version.
API: Added constants collection and constant object to API, giving control over adding removing, renaming and setting values for constants.
API: Made API more robust. Accessing fuels, regions, effects etc. using the singular syntax such as LEAP.Fuel("LPG") was previously marked as deprecated/obsolete, with the advice being to use the plural syntax (e.g. LEAP.Fuels). Now both syntaxes work equivalently (and the singular syntax will be retained.
API: New API properties and methods for more complete control over user variables (e.g. changing visibility, notes, min, max, default expressions, etc.)
API: New method LEAP.AddEffect to add an individual energy-sector environmental loading branch.
Mapping: Fixed error when linking certain shape files to a multi-regional areas in the General:Regions screen.
Tip: Use the API Objects tab in the Advanced:Edit Scripts screen to get a complete documented list of API objects and collections.
2020.1.38: 7/23/2021
Fixes to API addressing errors when adding Transformation modules and processes.
Added two new methods to the LEAP.Branch API to add and remove processes from the endogenous capacity expansion list: AddToEndogenousCapacity and RemoveFromEndogenousCapacity. These methods only work when called for Transformation processes and only when those are part of a module where the Endogenous Capacity variable is visible. Returns true if the method succeeds, otherwise false.
Results View now allows Transformation inputs and outputs to be reported for Transformation as a whole, not just for individual modules and processes. Use this feature with care as these values will likely double-count energy flows (e.g. electricity outputs from a T&D module and electricity outputs from an electric generation module).
Module energy balances can now be shown for simple modules in addition to detailed modules.
2020.1.37: 6/18/2021
Fixed erroneous warning message when starting up in automation mode.
Fixed range error when using optimization with an invalid system load shape.
2020.1.36: 6/15/2021
Fixed user interface bug that was causing some stock-turnover variables to be hidden in data entry tables when clicking on demand technology branches.
2020.1.35: 6/11/2021
Improved export of charts from LEAP to PowerPoint. Exported charts were disappearing from PPT in the 64-bit version (now fixed). Exporting now also works faster and in higher resolution and uses the standardized default title/chart layout in PPT. This makes it easier to quickly reformat an exported slide (e.g. using PPT themes or the new PPT "Design Ideas" feature). Dropped exporting in Windows meta-file as formatting was unreliable.
Fixed bug when exporting Results View tables to Excel encountered in cases when there was an a row showing avoided values and when using the match names option to cross-tabulate branch results. This bug caused some exported values to be misplaced versus those in the original LEAP table.
Improved the calculation of GHG emissions allocated to demand branches. This type of result should now give more accurate values in a larger number of cases. Note though that it relies on complex heuristic algorithms that trace back through the Transformation structure to calculate indirect energy use and emissions. These algorithms do not fully account for imports and exports and do not yet fully account for modules in which only some processes produce co-products. They also do not fully account for systems with feedback energy flows. Therefore, they should not be expected to yield energy results comparable to primary energy supplies or emission results comparable to energy-system-wide GHG emissions. However, they should yield a reasonable (if approximate) estimate of the indirect primary energy use and emissions associated with final energy demands (assuming all energy is produced within the system).
Improved Primary Energy Supply results in Results View. This result variable can now be broken down by an additional dimension (primary supply category) consisting of four elements: production, imports, exports, and stock changes. This makes the variable easier to compare with the results in energy balance reports.
Minor edits to the wording of the stock change variables to make it clearer that a positive value represents a supply from stock (i.e. a decrease in stocks) while a negative value represents an addition to stock.
LEAP Web Site: 6/1/2021
Updates to LEAP web site to increase responsiveness and improve security. Pages now loadup to 8 times faster. New longer/more secure passwords introduced and users now encouraged on home page to request a new one if their passwords were created earlier.
2020.1.34: 5/25/2021
Properly calculates auxiliary fuel use in optimization calculations. Previously, auxiliary fuel use was not calculated correctly and sometimes caused a module to show zero production.
Added extra integrity checking for areas with corrupted tree structures including references to deleted branches.
Improved code for connecting with LEAP server. Should eliminate HTTP 500 connection errors.
2020.1.33: 5/17/2021
Fixed HTTPS communication problems in 64-bit versions of LEAP that prevented some people from registering LEAP. People were seeing the error "Could not load SSL library". This was a problem introduced in 2020.1.32 when HTTPS communications were introduced. If you are having difficulties, please do a full download and install rather than using the built in Help: Check for Updates feature in LEAP.
Updated LEAP installation program to show LEAP logo during installation.
2020.1.32: 5/7/2021
Support for NEMO 1.6 including support for new Minimum Utilization variable (which sets a minimum level of dispatch for Transformation processes). In addition the Interest Rate variable has been updated to allow interest rates to vary among scenarios and years.
Improved communication with the LEAP web site for registration and log-in. More of this code is now multi-threaded for faster startup of LEAP. Also improved code that checks for and downloads updates. Now uses secure HTTPS rather than FTP protocols for updates and has better logging of the update process for troubleshooting.
Improved control over calculating NEMO scenarios on fast PCs with large number of processors. The underlying database used by NEMO could sometimes become locked causing calculations to fail on very fast PCs. To address this, a new option has been added on the Settings: Optimization screen to let you manually set the number of processors used by NEMO. The default is to let NEMO control this choice, which leads to half of the PC's processors being used. You can choose to increase the number of processors (which may reduce calculation time on very large models) or decrease the number if experiencing locking problems.
Fixed bug when using energy storage technologies with a single year of Current Accounts data. LEAP would report problems with historical dispatch data even though that variable is not applicable to energy storage technologies.
Fixed issue preventing use of Demand Side Load Shapes in branches specified using stock-turnover methodologies.
Fixed bug that could cause LEAP to generate errors if NEMO was uninstalled.
Added extra checking of the integrity of the tree structure to ensure data sets load properly.
Minor improvements to information in the Help:About screen.
Various other minor bug fixes and behind-the-scenes improvements.
Minor edits to LEAP Terms and Conditions adding text to clarify that aggregated and anonymized meta data may be shared with the LEAP community. You will be asked to review when you first run new version.
Updated help files.
2020.1.31: not released.
2020.1.30: 4/8/2021
Bug fix: When load shapes are specified for individual demand devices, multi-regional models were not calculating overall load shapes correctly.
Added new Minimum Utilization variable used to specify a minimum dispatch for processes in time slices in optimization calculations. This variable will be implemented in the next version of NEMO.
Added two new fuel economy units for use with jet fuel/air travel (kg/km and lbs/mile)
Improved storage modeling: added three new boolean (yes/no) variables that let you specify whether storage charge can be carried over between days, seasons and years. By default, carryover is allowed between days, but not between seasons or years.
Updated help files.
2020.1.29: 3/31/2021
LEAP now works with NEMO v1.4 to support calculation of scenarios for only selected years. This can make for much faster calculations. Past versions of LEAP and NEMO required calculation of results for every year in a scenario (from base year to end year). You can now specify that results be calculated only every X years (e.g. every 2, 5, 10 years). Consider the case of calculating results only every 10 years. For moderately sized data sets, calculations in this case are now roughly twice as fast. For larger models, calculations can be 20x faster or more. In one large model, calculation time decreased from 84 to 3.5 minutes. Results for calculated years may not be identical to those obtained when calculating all years, but NEMO uses several methods to reduce discrepancies between these two cases. See the NEMO documentation for details.
To specify calculations for only certain periods, enter an integer value greater than one in the "Results Every" box on the Settings: Years screen. You must be using NEMO to use selected years in optimization. OSeMOSYS does not support this capability.
NEMO v1.4 also features significantly faster multi-regional optimization calculations.
2020.1.28: 3/23/2021
Improved Data Checking for Optimization Models: making it easier to quickly identify conflicting data inputs using LEAP's integrated debugging environment and making it less likely that you will see infeasible solutions in solvers. LEAP now additionally checks for these situations: (1) a renewable target is defined but no processes are marked as being renewable qualified (error), (2) Annual minimum capacity additions x number of scenario years is greater than the total maximum capacity constraint (warning). (3) Annual maximum capacity additions x number of scenario years is less than the total minimum capacity constraint (warning). (4) Maximum capacity constraint is less than Exogenous Capacity (error).
2020.1.27: 3/21/2021
Improved Import Branches from Other Area feature to make it more comprehensive and robust. In addition to importing branches, expressions, fuels, regions, scenarios, etc., this option now also imports (and helps you map and merge) all other aspects of a model including yearly shapes, lifecycle profiles, user variables, constants, units, tags, and even references. It now does a better job of importing user variables including helping you to map the branches and tags used to control the visibility of user variables. The user interface has been streamlined, reducing the number of screens you have to step through and making the whole process simpler, quicker and more robust.
Upgraded ".leap" file format: With increasing concerns about computer security, we have found that ".leap" files now often get blocked by email servers when those files are sent as attachments. This is due to the files being based on unencrypted ".zip" archive files, which in turn contain the files that make up a LEAP area. These areas may contain ".vbs", ". js", ".py" and other executable scripting files, which are now often flagged by email servers as being disallowed attachments to email messages. A new ".leap" file format addresses this problem in two ways: by encrypting the ".leap" files with a password, and by renaming the extensions of files included within the archive. For example, ".vbs" files are stored as ".vbs_safe" files (making them not directly executable and so acceptable as email attachments). Files are automatically renamed back to their original extensions when a ".leap" file is installed into LEAP. LEAP is still able to install older format ".leap" files, but going forward the new file format is used when creating new backups of LEAP areas. This new file format should resolve most issues with emailing LEAP areas. Note however that you may still find that these files are sometimes too large to successfully be sent as attachments due to limitations in some email services. In general, we recommend sending LEAP areas as links using Dropbox, Google Drive and similar services.
Improved Script Security: We have also made improvements to the security of how LEAP runs scripts. Now by default, LEAP will only run scripts that have been digitally signed by SEI. This provides assurance that a script has not been tampered with by anyone outside of SEI. In the updated Settings: Scripts screen, you can change this setting to provide different levels of script security, ranging from never running any scripts (most secure) to running all scripts without confirmation (least secure - not recommended!). If you develop your own scripts for internal use, you may want to choose the setting marked "Run unsigned scripts & require approval before running." If you want to distribute your areas to other users and include scripts within those areas, then we recommend that you first digitally sign any scripts. You can do that using Microsoft's SignTool. You will need use this in conjunction with a code signing certificate. These are available from a variety of providers, such as COMODO or SECTIGO. Note that all of the sample scripts included with the areas distributed with LEAP (e.g., in the Freedonia and Asiana data sets) are now digitally signed.
Made compatible with latest upcoming version of NEMO.
Fixed bugs in how data is written for NEMO in multi-region data sets in which some processes are hidden in certain regions.
Fixed bug in Scenarios screen that sometimes caused the list of additional scenarios on the inheritance tab to become unresponsive.
Updated help files/user manual to reflect above changes.
2020.1.26: 3/11/2021
Fixed conversion factors for a couple of power units and added a few new power units.
Fixed problem with scaling factors in Asiana data set for climate (temperature change). Units were set to degrees, but should be thousandths of a degree.
2020.1.25: 3/10/2021
Bug fix: Fixed non-calculation of some scenarios in certain data sets, depending on the scenario selected as the counterfactual for Cost of Saved Energy calculations.
Bug fix: Emission factor branches were not being hidden on the tree when energy and non-energy effects were unchecked in the Settings: Scope screen.
Minor interface improvements in the screen used to import Yearly Shapes from hourly data.
2020.1.24: 2/24/2021
NEMO 1.31: A new version of NEMO (v1.31) has been released and is now supported by LEAP. This new version of NEMO takes advantage of the latest versions of Julia/Jump and results in much faster calculation times for the free and included Cbc solver. Calculation times have reduced dramatically (up to 40 times faster) to the point that Cbc can now be used as a practical alternative to commercial solvers in many situations. This should allow LEAP users to make much greater use of NEMO for advanced capacity expansion and dispatch modeling, without the need to purchase and install one of the expensive commercial solvers. LEAP continues to support the previous version of NEMO, but we strongly recommend upgrading to NEMO 1.3.
Notes on Using Commercial Solvers with NEMO: See this page for information on solver compatibility with NEMO 1.3. In some cases you may need to upgrade to the latest versions of CPLEX, GUROBI and MOSEK if you want to use those solvers with NEMO 1.31. Cbc and GLPK are automatically installed alongside NEMO. When using CPLEX, GUROBI and XPress. Be sure to install NEMO after installing the solver. LEAP now detects if NEMO was improperly installed before these solvers. If so, it instructs you to reinstall NEMO. In addition, LEAP will also now alert you if you are using an older version of NEMO. If so, it will offer to send you to the LEAP download page to get the latest version of NEMO.
Improved Modeling of Peak Loads and Reserve Margins: The time-slicing used in LEAP reflects some degree of averaging of how the actual load on a system varies within a year (by season, by day type and by hour). For example, if you choose two day/night slices these may not fully capture the variation in loads from hour to hour. Similar if you choose 4 seasonal time slices, you may not fully capture the peak months for heating and cooling. A new variable in LEAP called Peak Load Ratio allows you to adjust for this loss of fidelity and so more accurately reflect actual and likely future system peak loads. System peak loads in turn are used in calculating the system reserve margin and thus will affect how much capacity is built as controlled by the Planning Reserve Margin variable. The Peak Load Ratio value is calculated automatically in LEAP for each yearly shape that you create by importing from annual hourly load data, and you can use this data in your analysis using an expression to link the Peak Load Ratio to your library of yearly shapes. By default, the Peak Load Ratio variable is set to 100%. Results of existing models will not change unless you adjust this value (which must be between 0% and 100%).
Better Modeling of Trade Among Multi-Region Areas: We have added new capabilities for modeling trade among regions in multi-regional areas. You can now explicitly specify the fraction of requirements for each Transformation module output fuel in any given region that are imported from any another region. This new method uses two new variables Has Regional Imports defined at each Transformation module output branch, and Regional Import Fraction a percentage fraction defined in a series of branches (one per region) below each output fuel. When calculating, LEAP will iteratively calculate regions, accounting for the import requirements in each region based on the overall requirements in other regions and the specified Regional Import Fractions. This may require multiple calculation iterations until LEAP converges on a solution, so be sure to review the convergence criteria on the Calculations tab of the Settings screen. Note that this new capability is only available if you first enable "Allow Trade Among Regions in Area" on the Calculations tab of the Settings screen.
Energy Demand Modeling Now Optional: Previously, demand modeling was always required. In practice, this means that you can now choose to use LEAP for only non-energy sector emissions modeling. Use the Settings screen to switch demand modeling on and off.
LEAP now detects two common situations where Transformation data are probably improperly defined: when using historical dispatch rules but no Historical production data are defined, and when dispatching by process share but no shares are defined. In these cases, LEAP now warns you and assists you to fix the data. We hope this change will assist novice users who sometimes get stymied by these issues.
New and Improved Expression Functions: We have added a variety of new functions to LEAP's data definition language and improved others. Most of these functions are intended for interacting with LEAP 's tree structure and are primarily intended for use in external scripts. The new/improved functions are: BranchID, BranchOrder, BranchLevel, BranchNumChildren and BranchSiblingID. There is also a new HasTag function used to test if a tag is defined at a particular branch.
Fixes to handling of non-energy sector emissions in the Results View in cases where no energy sector emissions are defined.
Fixed the non-functioning Cancel button in the calculation progress dialog.
Improved Handling of Errors. If an error occurs in a year before the first scenario year. LEAP will now correctly report that the error occurs in the Current Accounts data set and will show that data in the Analysis View. Previously, LEAP always showed errors within a scenario.
Fixed various issues in Results view when choosing different types of results or when selecting different dimensions for the X axis or legend.
Various improvements to charts including the ability to set the width of lines in line charts and the font size for the historical/projection divider. Use the "wrench" icon on the chart toolbar to access these capabilities. Also fixed the display of optional marker points on line charts.
Improvements to stock turnover. Scrappage is now reported as a result variable.
Various other bug fixes including fixing a number of situations that led to range errors.
Updated help files to reflect new capabilities and new functions.
2020.1.21: 2/8/2021
Two fixes to chart copying/exporting features: (1) legend was sometimes inverted, and (2) the historical/projection divider did not draw correctly (text was overlapped).
Fixed corrupted icons in Fuels screen.
2020.1.20: 10/28/2020
FICO XPress Solver: Added support for the FICO XPress solver for use with LEAP and NEMO's optimization calculations. XPress must be purchased and installed separately from LEAP and NEMO. Contact FICO for a quotation here. LEAP and NEMO now support the following solvers: GLPK, CBC, MOSEK, CPLEX, GUROBI and XPress. NB: Make sure you are using NEMO v1.2.0 before using LEAP with XPress.
Improved Time Slices and Yearly Shapes: LEAP now supports a new time slice configuration of days divided into 12 x 2-hour time slices. This in addition to the many other existing configurations. In addition, when yearly shapes are created by importing from annual load shapes (8760 hourly values), those shapes will be retained and automatically regenerated both when the user changes the time-slice configuration or when a shape is changed from an energy load shape to a peak load shape. Previously, a shape would have been completely erased in either of these circumstances. This new capability makes it much easier to explore the pros and cons of different time-slicing configurations without fear of losing data. For example, more slices generally will yield more precise results, but will require longer calculation times. You might want to use fewer slices when first building and testing a model (e.g. 4 seasons x day/night) and then use more detailed slicing once you are ready to see near-final results (e.g. 12 months x weekday/weekend x 24 hours).
Fixed various other bugs in the Time Slices and Yearly Shapes screens (e.g. erasing shape values could cause LEAP to hang) and using the Time Slice Settings screen caused a crash when using non-English regional settings (due to differently named months).
Fixed various other bugs in LEAP including various range errors, access violations and file access errors reported by users. Have also made LEAP more fault tolerant in situations where it is unable to delete or write to a text file (e.g. in cases where those files are read-only or otherwise inaccessible). This sometimes happens in cases where a file is being actively scanned by certain anti-virus software (see below).
Better Handling of Anti-Virus Software: Some anti-virus (AV) programs (notably ESET, AVAST and AVG) can sometimes interfere with the correct operation of LEAP due to the way they aggressively lock files during real-time scanning. LEAP now detects when one of these three programs is running, and during LEAP startup it alerts users about the potential problems and encourages them to ensure that these AV programs are setup to exclude the "LEAP Areas" folder (and sub-folders) from their scans. Cloud file-synching apps like Dropbox, OneDrive and Google Drive can also sometimes cause similar problems. To avoid these, we recommend that your "LEAP Areas" folder is marked to NOT be synchronized to the cloud using one of these apps.
Fixed an error in LEAP's Optimization calculations that could erroneously report an error related to the Capacity, First Simulation Year, and Historical Production variables in optimization-based scenarios, even though these last two variables are not relevant in this situation.
Fixed an issue in which incorrectly specifying the Dispatch Rule as "Merit Order" rather than as "MeritOrderDispacth" could cause a circular variable reference resulting in LEAP crashing without showing any error message. Also made LEAP generally more robust in cases of circular variable references so that invalid variable references are properly reported, and LEAP does not crash.
2020.1.19: 9/9/2020
Now supports faster single-pass calculation of MACC reports (a.k.a. Partial Analyses). These calculate much faster than MACCs created using the default Retrospective Analysis method, but are less thorough because they ignore the potential for interactions among scenarios. We've added in this option to allow for rapid prototyping and debugging of scenarios, but recommend using the full Retrospective Analysis method when creating MACCs for use in final reporting. A new option in the MACC setup screen is used to select either the slower Retrospective Analysis or the faster Partial Analysis methods.
Further UI improvements to the Expression builder. Now properly handles expressions split over multiple lines.
Improved handling of imports within the Optimization calculations. Now properly alerts you if the Output Shortfall Rule is set to use imports within an optimized scenario. This is incompatible with an optimization methodology. Instead, you should create a process to explicitly represent imports (with feedstock fuel set to be the same as the output fuel of the module).
Fixed bug in Time-Series wizard when entering a value when your computer is set to use a non-english number format.
2020.1.18: 9/2/2020
Fixed issue with cost-benefit summary report not displaying correctly when building a data set from scratch.
2020.1.17: 9/1/2020
Fixed range error when adding device branches while using the stock-turnover methodology.
Fixed error in which LEAP incorrectly reported device shares not summing to 100%, when using a useful energy methodology and when the energy intensity was zero.
Improved operation of the Expression Builder tab in Analysis View. Previously LEAP prevented changing the selected branch in the tree if the Expression Builder was open. Now this only occurs if the expression in the Builder differs from that in the table above (i.e. while the expression is being actively edited). This results in fewer annoying warnings. Also added a Restore button to pull the saved expression back into the Expression Builder.
Fixed issue in which LEAP was incorrectly writing data for NEMO in cases where time slices were set to all 365 days.
Minor improvements to the Yearly Shapes screen.
2020.1.16: 8/18/2020
Fixed issue where LEAP would not show stacked charts for Fuels and other dimensions in Results view - problem caused by changes in last release (2020.1.15).
Minor changes to improve ability to import/upgrade very old (pre-2012) format LEAP areas.
2020.1.15: 8/10/2020
When in Analysis View and scrolling through records in the upper data entry table, the lower table summarizing values now automatically scrolls to and highlights the corresponding row of values.
Fixed ordering of branches in charts in Analysis View: chart order now matches order in the tree and the upper data entry table.
Fixed "Number too large" error when evaluating some complex expressions that yielded a result of +/- infinity.
Improved top-down stock-turnover calculations to now properly handle situations where sales are specified as a function of retirements.
Minor edits to default data for a newly created area, removing notes from Freedonia area.
2020.1.14: 7/29/2020
New Version of IBC with More Flexibility for Modeling PM2.5 Concentrations: Past versions of IBC required a fixed base year of 2010. Base year population-weighted concentrations of PM2.5 in 2010 were always estimated using satellite-based calculations (based on van Donkelaar, 2016) rather than using the national emissions calculated in LEAP. Future changes in emissions calculated in LEAP (plus changes in rest of world and natural background emissions) were used to calculate future PM2.5 concentrations and health impacts.
This new version of LEAP-IBC now also gives the option to calculate concentrations directly from LEAP's emissions. This has two main benefits: (1) it allows IBC to be run with any base year (2) it allows IBC to be used, even in cases where a model does not contain a full accounting for all national emissions. However, due to the non-linearity of the relative risk functions in LEAP, you should be careful to ensure that your emissions do represent the majority of total national emissions.
To support this new method, we've updated the Settings screen to allow you to choose the default PM2.5 scaling method (currently there are two options: None or Van Donkelaar, with additional methods coming soon). We've also added an option for selecting different health impact relative risk functions (also coming soon). Both these options can also be varied by scenario to assist with comparing among different methods (see below for description of sensitivity analyses or see this for information on using different scaling methods in different sensitivity scenarios).
This new version of LEAP-IBC also fixes one bug with how results were being passed to IBC and also fixes another issue with the GeosChem Adjoint-based PM2.5 coefficients used in IBC that caused it to calculate incorrect contributions of different primary pollutants to the overall base year PM2.5 concentrations (when using the previous satellite-based estimates). The contribution of emissions of black carbon (BC), organic carbon (OC), ammonia (NH3) and sulfur dioxide (SO2) were being systematically under estimated, while Nitrogen Oxides (NOx) and other pollutants were over estimated.
Updated Settings Screen: To reflect the above changes to IBC, the LEAP Settings screen and help files have been updated. The Scope & Scale tab has been simplified (removing most IBC-related options), which have been moved to a new "IBC" tab containing more options and better guidance on all the various options for running IBC.
Fixed bug where adding or deleting fuels from certain branches in the tree was not triggering the Resources, Statistical Differences and Stock Change branches to be immediately refreshed.
Updated API to better support references to results variables in scripts run via the CALL function. Also added two new properties to the API Scenario object required to support running of the new version of IBC.
Support for Sensitivity Analysis: Added new capability to create special sensitivity scenarios. Normally in LEAP, all scenarios share the same Current Accounts values. However, in a scenario marked as a sensitivity, the expressions entered in a scenario are now allowed to override the values calculated for the Current Accounts data. To create a sensitivity scenario, go to the Manage Scenarios screen and check the box marked Sensitivity.
2020.1.13: 7/24/2020
Updated Freedonia, Transport Exercise and Optimization Exercise areas to match newly updated training exercises and forthcoming training videos. Updates to exercises reflect UI changes in LEAP2020 vs LEAP2018.
Minor changes to Notes screen: added ability to delete all notes across all tree branches.
Minor updates to API.
2020.1.12: 7/16/2020
Improved Scenario Expressions screen. This now has more options for showing the expressions specifically entered into one or all scenarios. It includes new options for sorting the list of expressions and a new button for deleting redundant expressions that are a duplicate of the ones entered in the parent/ancestor region or scenario. A new pane at the bottom the screen shows the ancestor expression and the ancestor region/scenario.
Improved backup: You can now opt to exclude results when creating ".leap" back up files. This, along with changes to optimize how files are compressed, makes backups considerably faster to create and makes them smaller on disk (up to 60% smaller on disk).
Better handling of missing binary results (.bin files): If any of these files have been deleted (e.g. if you manually deleted them to save disk space), LEAP will now detect this and recalculate regions/scenarios as needed.
Fixed parsing of certain expressions in which a function is itself included as a parameter with a time-series function (Interp, Step, etc.)
Fixed problem in evaluating time series expressions in scenarios in cases where the time series expression (e.g. Interp) differs from the Current Accounts expression and contains values for years before the base year.
New InterpNIV function: This calculates a value by interpolation among the listed year/value pairs. Unlike the Interp or InterpFSY functions it never uses any implicit values.
Improved automation registration. Running LEAP /regserver without admin privileges previously generated an error that was not understandable. It now responds with better guidance.
Fixed problem with the Tree: Tags sub menu not working.
Fixed error on opening an area if Builder tab open in Analysis View.
LEAP API: Fixed error when setting LEAP.visible to true after LEAP is started up via the API. Also fixed a problem with the LEAP.CanQuit function, which was not working correctly if the main LEAP screen was not visible. The LEAP.Quit function can now be used to force LEAP to exit (but not normally recommended - see below for best practice startup/shutdown code).
Here is some sample code in Visual Basic for Applications (VBA) showing how to start up and shut down LEAP (e.g. from within an Excel Macro).
-
Dim L As Object
On Error Resume Next
'Startup
'Try to connect to an existing running copy of LEAP (note the leading comma!)
Set L = GetObject("", "LEAP.LEAPApplication")
'Or if there is no existing running copy, create a new instance of LEAP
If L Is Nothing Then
Set L = CreateObject("LEAP.LEAPApplication")
End If
'Ensure LEAP is fully started up
While (Not L.ProgramStarted)
Application.Wait (Now + TimeValue("0:00:01"))
Wend
L.Visible = True 'Make LEAP visible
MsgBox(L.ActiveArea.Name) 'Do something with LEAP such as showing name of area
'Shutdown
'First check to see if it is ready for shutdown (CanQuit).
'If there are unsaved changes this will prompt you to save
'Returns false if you cancel that dialog or if a supporting screen (regions, fuels etc.) is open.
'You can also use LEAP.SaveArea to save the current area first
If LL.CanQuit Then
Set LL = Nothing 'Exits LEAP and removes its icon from the Windows Taskbar
End If
2020.1.11: 7/6/2020
Fixed a problem with how expressions were inherited across regions. Sometimes, an expression in a template region was overriding specific expressions entered in other regions.
Fixed importing of values from Excel in the Analysis: Import from Excel Feature. This was sometimes causing numbers to appear incorrectly rounded to a large number of decimal places.
Fixed issue with 64-bit version of LEAP sometimes not self-registering with Windows during installation. Tip: Run RegisterLEAP.BAT from the Windows command prompt (with administrator rights) to manually register LEAP and the scripting engine.
Fixed missing "remove" button in the Windows Control Panel: Programs and Features screen for 32-bit installations of LEAP. If you want to remove earlier versions of LEAP, please use the uninstall shortcut available from the LEAP folder within the Windows Start Menu. Please contact us for further guidance if you are left with other ghost installations on the Programs and Features screen that you want to get rid of. Apologies for this inconvenience.
Fixed a bug when trying to show the Results view, when the last saved result was a gridded map, but the computer being used does not have MapWinGIS installed on it.
Fixed a crash when calculating data sets that use script-based events in cases where the Microsoft scripting engine or LEAP API are not properly registered.
Fixed issue with handling of discount rates in MACC curves if monetary year is after the base year.
Fixed bugs in MACC curves affecting refresh of multi-region data sets.
Fixed bug when selecting "selected" items in a Results view dimension. This required using the option twice before the selection would be honored.
Updated LEAP to use the latest version of the Delphi language (Delphi 10.4 Sydney). For now at least, this requires removal of a few options for printing the main data tree, scenario tree and various data tables. Let me know if having the capability to print trees is important to you and I will consider trying to reimplement this in a future version. My inclination is to drop this capability to help promote paper-use reduction. As a fall back, you can use the Windows Snipping tool (Shift-Win-S) to capture tree images and the Export to Excel feature to export tables to Excel for subsequent formatting/printing.
Added ability to globally set the counterfactual costing scenario used in the Cost of Saved Energy calculations. This is accessed as a new option in the Advanced menu.
Minor improvements to Results View toolbar to ensure all relevant options are displayed (less need to click the more/less button).
2020.1.10: 6/24/2020
32-bit version can now access more memory (now 4GB up from 2GB previously).
Fix to Analysis: Import from Excel feature: expressions sometimes not properly imported for useful energy intensities.
2020.1.9: 6/19/2020
Various bug fixes and improvements to the Analysis View: Export to Excel/Import from Excel features. When importing expressions, blank cells in Excel now cause the imported expression to reset to the inherited expression from the parent scenario. Fixes and improvements when importing values rather than expressions. Improved screen layout in Export to Excel screen.
Further fix to GrowthFromYear function.
Other minor fixes.
2020.1.8: 6/18/2020
Fix to address incorrect checking of device shares when using non-transportation stock turnover methods.
Fixed copying/pasting of branches within a single LEAP area.
Fixed copying and pasting of ranges of data from Excel into LEAP.
2020.1.7: 6/13/2020
Fixed Module Cost Balance report, which was not working in Results View.
Fixed error when installing an older format area over an existing current format area. Tip: you can install a new area by dragging and dropping a ".leap" file onto LEAP's main screen.
Fixed grouping of smaller series in Results view charts: was not working correctly when some values were negative.
Fixed occasional problems with Remainder function. Function could calculate incorrect values for device stock share or device sales share variables when doing top-down stock turnover calculations.
Improved setting of branch properties when using stock turnover calculations. Tip: if the stock share or sales share variables are not visible, view the properties of a technology in a lower level branch to force LEAP to refresh which variables are visible at higher-level branches.
Fixed Differences vs. Previous Year Values reports, which was not working in Results View.
Fixed calculation issue with GrowthFromYear function in cases where first growth year is multiple years after the last historical year.
Improved checking of whether CPLEX and GUROBI solvers are properly installed. Now warns user if they are not properly referenced in the Windows PATH statement.
Behind the scenes changes for LEAP and NEMO to support an additional solver (FICO XPress). New versions of LEAP and NEMO coming soon with support for XPress and with more robust handling of solvers.
Minor improvements to Fuels and Regions screens.
2020.1.6: 6/6/2020
Further fix to Yearly Shapes screen importing options.
Fix and minor update to Help:Check for Updates function. Progress bar was not being updated.
Fixed problem with New Area function caused by changes in v2020.1.4.
2020.1.4: 6/5/2020
Now checks for and fixes areas with duplicate fuel, effect, region or scenario names. These data sets were causing errors when opened in previous versions of LEAP.
Removed a couple of duplicate environmental effects.
Fixed problems importing load shapes.
Fixes and improvements to Yearly Shapes screen. Added series highlighting when hovering over legend, new Erase Values and Copy Season options, improved drag-to-edit, and improved display of charts. Copy Season is accessed from the screen's pop up menu.
NEMO v1.1.1 fixes problems when using some versions of the CPLEX solver. You can safely install NEMO v1.1.1 on top of a previous version. LEAP2020.1.4 or later is required when using NEMO v1.1.1. Both are available from LEAP downloads page.
2020.1.3: 5/30/2020
Fixed problem on some computers with NEMO not running properly due to LEAP not finding the tee.exe utility.
Fixed operation and export of scaling factors in energy balances.
Fixed issues with importing load shapes when time slices set to use two periods (day/night) or 4 periods (morning, day, evening, night) for lowest level (daily) time slice groups.
Updated software and help files to reflect new LEAP URL (leap.sei.org) which replaces www.energycommunity.org
Updated a few remaining parts of LEAP that still referred its old long form name (Long-range Energy Alternatives Planning system).
Updated LEAP-WEAP sample area.
2020.1.2 (First Public Release): 5/24/2020
LEAP2020 is a major update, one that will help users to better develop their Nationally Determined Contributions (NDCs), plan to meet Sustainable Development Goals (SDGs), plan air pollution abatement strategies, and quantify the benefits of low emission development pathways. LEAP2020 has a new long name to reflect this broadened focus. It will now be known as The Low Emissions Analysis Platform.
LEAP2020 includes many new capabilities, which make it more useful for modeling and evaluating energy, climate and air pollution transition pathways. Highlights include:
LEAP2020 is backwards compatible with data sets created in earlier versions of LEAP.
NEMO: the Next Energy Modeling system for Optimization: NEMO is a fast new optimization framework, developed at SEI, with support for multiple free and commercial solvers. NEMO allows LEAP to be used to solve larger optimization problems in a reasonable amount of time. NEMO is developed and supported in-house at SEI and is closely integrated with LEAP. This allows us to provide better support to users, and to more easily create upgrades. NEMO is also an important foundation for future improvements to LEAP, such as the planned ability to do detailed network and power-flow modeling and integrated energy system optimization modeling.
More Flexible and Easier-to-Use Time Slicing and Modeling of Energy Storage: Support for detailed daily/hourly time slices and modeling of energy storage has been added. These new features are important for examining the potential for variable renewable energy sources, like wind and solar power, to drive deep decarbonization.
Marginal Abatement Cost Curves (MACCs) for assessing the cost and abatement potential of mitigation options and for prioritizing implementation of mitigation measures.
Decomposition Reports: This new type of report can be used to analyze the factors driving the trends in scenarios, based on the well-known IPAT methodology.
GIS-based Mapping including the ability to create geographic projections of likely future emissions hot spots, which can be used to highlight the importance of environmental justice in low emission development planning.
Upgraded Integrated Benefits Calculator: IBC, the Integrated Benefits Calculator module has been upgraded with support for new impact indicators such as Years of Life Loss (YLLs) and now shows results disaggregated by age and gender. These new capabilities allow LEAP analyses to better quantify how different energy transition pathways might impact upon or benefit different groups in society such as women and children, and making it more useful for planning how to meet the Sustainable Development Goals (SDGs).
Indoor Air Pollution: LEAP can now be used for modeling the health impacts of indoor air pollution (primarily from cooking), taking into account likely levels of exposure among different household members (cooks, other adults, children) and genders (male and female) and examining the likely health benefits of transitions to cleaner cooking technologies. This new methodology is based on the HAPIT-III tool developed by the Clean Cooking Alliance and is closely integrated with IBC's ambient air pollution calculations to avoid double-counting impacts.
Improved Stock-Turnover Modeling: LEAP's stock-turnover modeling for vehicles and appliances has been improved to allow sales to be specified as a function of past retirements. This can be important in constructing models that examine how an existing stock of devices might gradually be replaced by new more efficient or lower emitting devices.
Usability Improvements: LEAP 2020 includes many updates that improve work flow and make it easier-to-use. Notable improvements include: support for working on multiple monitors, better support for running multiple simultaneous instances of LEAP, improved data importing and exporting, improved data editing, and improved options for visualizing and interpreting results.
Quality Improvements: A large number of bug fixes and a new behind-the-scenes regression testing system help improve the robustness and reliability of LEAP. LEAP2020 is fully backwards compatible with areas created in older versions.
New Modeling Functions: LEAP's data definition language has been expanded and improved with 40 new functions (bringing the total to 340) supporting modeling in such areas as: more flexible definition of time-sliced variables, support for quickly switching among different optimization frameworks and solvers, and better integration with the API and support for indoor air pollution modeling.
Updates to Documentation: The user manual/help system has been thoroughly updated and expanded with more than 80 new pages of help. It describes all the new capabilities of LEAP2020 and has been updated to reflect any redesigned screens.
A detailed list of changes is included below. Please also refer to the new videos that demonstrate some of the new features.
Detailed List of Changes in LEAP2020
NEMO, the Next Energy Modeling system for Optimization: is a new and super-fast optimization framework with support for multiple free and commercial solvers. NEMO is derived from the OSeMOSYS optimization framework, which as been included in LEAP for many years. However, but NEMO features substantial recoding of time slicing and energy storage modeling and is completely rewritten in a new programing language called Julia, originally developed at MIT. Like OSeMOSYS, NEMO is being made available as open source software. Julia is fast, flexible, and well suited for scientific and numerical computing. It also has a vibrant and growing community of users. This makes NEMO good for the types of optimization problems encountered in LEAP: linear (LP) and mixed integer linear programming (MILP), and especially for large problem sets. Other advantages of moving to NEMO include its support for many multiple free and commercial solvers. The first version of NEMO supports GLPK, CBC, CPLEX, GUROBI and MOSEK, with support for other solvers coming soon (XPress). CPLEX, GUROBI, XPress and MOSEK must be purchased separately from LEAP/NEMO.
You can continue to use OSeMOSYS in LEAP2020, or you can even use different combinations of frameworks and solvers in different scenarios within a single model. This can sometimes be useful in cases where you wish to test and compare the results generated by each framework/solver combination. Use of NEMO within LEAP is seamless. LEAP users do not have to learn programming or work directly with NEMO's data and results files. NEMO is downloaded and installed separately from LEAP and is available here. Aside from developing NEMO, we have made optimization modeling easier than ever in LEAP via a simplified user interface and new easy-to-read visualizations for querying the detailed results coming from NEMO. NEMO has been developed by Jason Veysey of SEI.
More Flexible and Easier-to-Use Time Slicing: Support for detailed daily/hourly time slices and modeling of energy storage has been added. This makes for more realistic assessments of the implications of large-scale use of variable renewable energy technologies (especially related to use of wind, solar and energy storage and for modeling the seasonal and diurnal variations in energy consumption in different technologies). The redesign of time slicing, allows LEAP to better model daily (diurnal) variations in demand and supply. For example, you can now model both seasonal, weekly and hourly variations in demand and supply. Time slicing is now easier to use and more flexible. For example, you can customize the definitions of seasons of weekdays/weekends and create two, four, or 24 hourly periods in each day. LEAP can also now calculate energy curtailment from non-dispatchable wind and solar power plants. New functions have also been added to LEAP's data definition language to support the specification of how demand and supply may vary among seasons, days and hours. A new time slice setup screen allows you to customize the definitions of seasons (start/end dates) and weekdays/weekends.
Modeling of Energy Storage: LEAP now supports modeling of energy storage. This requires use of NEMO and works in conjunction with the more flexible time slicing arrangements in LEAP2020. Energy storage is specified as a new type of Transformation process. It makes use of existing variables such as capacity, efficiency, and capital and O&M costs, as well as new variables such as the full load hours of the storage process or the starting and minimum charge levels. Note: energy storage modeling is not yet supported in simulation-based scenarios, or when using the OSeMOSYS framework
Apart from the enhancements to support energy storage calculations, we have also also upgraded LEAP's Results View to better show energy storage results. The example screen below shows power generation from an electricity module for a year divided into 4 seasons and 24 hourly periods. Notice how the energy storage process is charged and discharged in different time slices in order to make use of surplus solar and wind energy in some periods and to help meet peak demand in other periods.
Marginal Abatement Cost Curves (MACCs): MACCs are useful for assessing the cost and abatement potential of mitigation options and for prioritizing implementation of mitigation measures. MACCs can now be automatically calculated and displayed within LEAP through the Summaries view. MACCs in LEAP are calculated using the well-established Retrospective Systems Approach. LEAP first identifies the most cost-effective policy measure (scenario), and then goes on to implement scenarios in order of cost, assuming that each is implemented in addition to the previously calculated scenarios. MACCs are presented in standard fashion with cumulative abatement plotted on the X-axis and the unit cost of abatement plotted on the Y-axis, so that the area under the curve is the total cost of implementation. This requires multiple passes of LEAP's calculations to identify how the cost of implementing each measure is affected by all previously implemented measures. The results from a MACC analysis may differ from those in LEAP's integrated cost-benefit analyses, in which all measures are analyzed together. In a MACC analysis, the costs and abatement benefits of measures are affected by the assumed order of implementation of measures. MACCs in LEAP are highly configurable and their use can go beyond examining GHGs. For example you can examine all sorts of types of abatement policies from GHGs to local air pollutants. You could even create a MACC that looks at avoided premature mortality from air pollution. Use the MACC setup screen shown below to specify the configuration of the MACC.
Decomposition Reports can be used to analyze the factors driving the trends in scenarios, based on the well-known IPAT and Kaya methodologies. LEAP expands on those approaches by allowing for analysis of the factors affecting any ultimate socioeconomic indicator of an energy system (GHGs, air pollutants, concentrations, premature mortality, etc.) and any contributing factors (population growth, GDP growth, energy intensities, emissions intensities, deaths per unit of emission, etc.). A setup screen accessed from the Summaries view is used to create a decomposition analysis (shown below). Decomposition results are displayed in a variety of table and chart formats including the "waterfall" chart shown below.
GIS-based Mapping: LEAP2020 now allows you to assess the geographic distribution of energy use and environmental loadings (emissions), and examine how that distribution might change over time and among scenarios. The results can be viewed within LEAP's new mapping screens in Results view. We hope this new feature will be useful in helping to identify emerging emissions hot spots and for monitoring progress on reducing the emissions burdens faced by different communities.
Geographic mapping is built around three new areas in LEAP: (1) a new Geographic Mapping screen used to create a named list of raster (grid-based) proxy GIS data sets containing socioeconomic data that can be used to downscale national-level emissions to a more local scale. (2) A new Geography variable used to specify how energy use and emissions at a particular branch in the LEAP tree are allocated among the map squares in an Area. This variable is used in conjunction with four new functions: Allocate, AllocateEvenly, AllocateNone and PointSource. The Allocate function works in conjunction with the mappings created in the Geographic Mapping screen. For example, you might make use of a geographic population data set named "Population" as the basis for allocating household sector emissions among different regions of your country, by using the expression Allocate(Population). Similarly, or you might use a data set named "Roads" describing road-kms per grid square as the basis for allocating road transport emissions using the expression Allocate(Roads). LEAP calculates the emissions from every branch in the tree in every year of every scenario and then allocates these values among the grid squares in your area. (3) The results are displayed in LEAP's Results View in its new Gridded Map chart type (example shown below).
When viewing gridded maps, a new split screen view (shown above) can be used to show both a map and a color-coded table containing all the gridded values. You can navigate among the table values by holding down the control key while hovering over the map. The table will then automatically scroll to show the values corresponding to the map grid squares under the mouse cursor.
Updates to IBC: the Integrated Benefits Calculator module has been updated with support for new impact indicators such as Years of Life Loss (YLLs) and with results now disaggregated to show impacts by age and gender. These new capabilities allow LEAP analyses to better quantify how different energy transition pathways might impact or benefit different groups in society such as women and children, making it more useful for planning how to meet the Sustainable Development Goals (SDGs).
To help you migrate IBC-based data sets that were developed in earlier versions of LEAP, we have added a new menu option under the Advanced menu labeled Check for IBC Compliance. This option will check and update the data structures in a model to ensure they are compliant with the information required in the latest version of IBC.
Indoor Air Pollution: LEAP can now be used for modeling the health impacts of indoor air pollution (primarily from cooking), taking into account likely levels of exposure among different household members (cooks, other adults, children) and sexes (male and female) and examining the likely health benefits of transitions to cleaner cooking technologies. LEAP's new capabilities are based on the approach developed in the HAPIT III tool (Household Air Pollution Intervention Tool) developed by the Clean Cooking Alliance and to date applied for studying local interventions on clean cooking technologies. HAPIT III's methods have been adapted for long-term national-scale scenario analysis in LEAP and integrated with the existing ambient air pollution calculations carried out through LEAP's Integrated Benefits Calculator (IBC) module. The analysis of indoor air pollution is closely integrated with the ambient air pollution impacts modeling in LEAP-IBC. For example, both methods use the same relative risk functions, based on the Global Burden of Disease studies. LEAP2020 also includes methods that help to avoid double-counting the health impacts of indoor and ambient air pollution.
Improved Stock-Turnover Modeling: LEAP's stock-turnover modeling for vehicles and appliances has been improved to allow sales to be specified as a function of past retirements. This can be important in constructing models that examine how an existing stock of devices might gradually be replaced by new more efficient or lower emitting devices.
Usability Improvements: LEAP 2020 includes many updates that improve work flow and make it easier-to-use. Notable improvements include:
Multiple Instances: LEAP now fully supports running multiple instances of LEAP simultaneously. The second and subsequent instances of LEAP can be run at the same speed as the first instance, and you can close instances in any order. Previously, the first instance had to stay open until all other instances were closed. You can also now run LEAP2020 and LEAP2018 concurrently to facilitate comparing results between each version.
Multiple Monitors: LEAP now fully supports computers with multiple connected monitors.
Results Visualization: The display and usability of charts and maps has been improved: (1) Tags are now seamlessly integrated into Results View reports. If you create groups of tags, these will automatically appear as additional dimensions in relevant charts. The new Tag Groups screen can be used to specify which tags are used for reporting purposes. (2) A new "net value" line can optionally be shown on top of bar charts containing positive and negative values, making it easier to see overall trends. (3) You can now highlight a series in a chart (while graying out all others) by hovering over the series name in the chart legend. (4) Maps have been upgraded, for example with new formatting options and with the ability to use Internet-based tile services (Bing and Open Streets) to show high-resolution background images in maps. (6) Other visualization improvements include revamped Summaries reports, which are now more flexible, and easier to edit and read, and an expanded library of color palettes for charts.
Improved Data Editing: As LEAP's capabilities expand, some data screens now show a large number of variable tabs on screen. This can sometimes feel a bit overwhelming. To counter this, you can now use the Variables selection box to choose to show only certain categories of variables (cost variables, capacity variables, dispatch variables, etc.).
Improved Importing/Exporting: Export to Excel has been improved making it more flexible over which data are exported. Paste Special has been improved with the addition of an option to transform imported values (e.g. by adding or multiplying by a factor).
Other Usability Improvements include faster adding and deleting of branches, better editing of notes, smarter placement and retention of supporting screens, and improved operation the view bar and full screen mode. Note also that the old Basic Parameters screen has become Settings: a more standard naming approach.
Updated API: LEAP's Application Programming Interface (API) has been expanded and improved. In particular, scripts or functions called from LEAP's Events screen now automatically know the "context" from which they were called: the branch, region, scenario and year. This greatly expands the types of script-based functions that can be written using LEAP's CALL function. An example of this can be seen in the function used in the Asiana data set to calculate indoor deaths for different genders, ages and diseases - all using a single function call. Use the Advanced: Edit Functions menu option to review this function.
Events: Events in LEAP have been improved. You can now specify scripts to run on additional events such as when an area is opened or an error occurs. In addition to running scripts, you can now have LEAP display a message or send an email or an SMS text message when an event occurs.
Quality Improvements: A huge number of bug fixes and a new behind-the-scenes regression testing system help improve the robustness and reliability of LEAP. LEAP2020 is fully backwards compatible with areas created in older versions. We have also enhanced the checking of data to better test for reserved, disallowed, or duplicate names. LEAP automatically updates data sets with such naming problems and will alert you if any branch, fuel, region or effect names are adjusted when opening an area.
New Modeling Functions: LEAP's data definition language has been expanded and improved with 40 new functions (bringing the total to 340) supporting modeling in such areas as: more flexible definition of time-sliced variables; support for quickly switching among different optimization frameworks (OseMOSYS and NEMO) and different solvers (GLPK, Cbc, CPLEX, Gurobi, amd MOSEK); and better integration with the API and support for indoor air pollution modeling.
Updates to Documentation: The user manual/help system has been thoroughly updated and expanded with more than 80 new pages of help. It describes all the new capabilities of LEAP2020 and has been updated to reflect redesigned screens.

 calculated and displayed in LEAP2020.)


 from both ambient and indoor air pollution.)
LEAP 2018
2018.1.40: 2/24/2020
Fixed error in calculation of remaining energy requirements when calculating a Transformation module in which the shortfall rule is set to RequirementsRemainUnmet and Usage Rule is set to ExportPriority.
2018.1.39: 2/23/2020
Fixed occasional crash when exiting LEAP and saving data.
Minor UI fixes affecting repainting of data entry table.
Behind the scenes changes that allow LEAP2018 to be run simultaneously with the upcoming LEAP2020.
2018.1.38: 2/21/2020
Improvements to expression editing. Reimplemented a half second delay before popping up the branch, variable and function popup dialogs, which then do not appear if the user keeps typing.
When dragging and dropping a branch from the tree into the Expression Builder, this would often cause a new branch to be selected - causing edits in the Expression Builder to be lost. Now, when the Expression Builder is open in Analysis View, a new tree branch cannot be selected, making it easier to edit in the Expression Builder.
Further improvements when importing from an Excel Template spreadsheet. When importing by name (rather than by ID), LEAP will now import expressions by scanning scenario, variable and region names as well as branch names.
Other minor UI changes.
2018.1.37: 2/12/2020
Fixes to the Import from Excel function. Now handles units and scaling factors better. Will also now allow you to import from an Excel sheet even if its area name differs from your LEAP area name. Shows a warning message and asks you to confirm you want to import, even though names differ. Please be careful with this!
Fixes to the Insert Branches From Other Area function.
Fixes to the Create/Update Branches from Excel function. This also now better summarizes the regions for which data will be imported.
Improved operation when dragging and dropping files onto the LEAP main screen to install an area.
Updated installation routines to use a new digital code-signing signature that runs through Feb 2023.
2018.1.36: 1/28/2020
Additional bug fixes including fixing a problem when copying and pasting branches.
2018.1.35: 1/24/2020
The previous three versions of LEAP (32, 33, 34) had a serious issue with the user interface, including a tendency on some computers for the screen to become unresponsive or fail to fully repaint. This was due to changes in the underlying programming language and components used to create LEAP. The problems affected both the 32-bit and 64-bit versions. 2018.35 addresses these issues and is recommended for all users, but particularly for anyone using versions 2018.1.32-34. Apologies to anyone inconvenienced by this issue.
2018.1.33 and 2018.1.34
These two versions have been withdrawn as they had a serious problem that could cause the screen to lock up.
2018.1.32: 12/3/2019
Further improvements to the Analysis: Export to Excel function: now properly exports the denominator units for many more variables.
Better handling of situation where Excel is busy when attempting to export to Excel and thus not available for communication with LEAP (e.g. has a Save dialog open or a cell is being actively edited).
Fixed editing of non-energy sector costs. Drop down units selection box did not show currency units.
2018.1.31: 12/1/2019
Fixes and enhancements to the Analysis: Export to Excel and Import from Excel options:
Fixed problem with exporting in which certain branches and variables sometimes were not exported when using some export options.
Fixed problem with incorrect units and scaling factors being exported.
Enhanced error checking during import. Now checks names and classes of imported units and won't allow invalid units to be imported. Alerts and gives option to skip invalid records.
Better reporting of problems encountered during importing (such as invalid unit names or classes or invalid scaling factors).
Improved importing to better reflect scenario and regional expression inheritance. No longer creates multiple duplicate expressions in scenarios or regions that are inherited from an ancestor.
Removed the option to make inheritance optional during importing. Minor updates to import/export dialogs.
Fixes problem with elements of the main screen (such as the main toolbar), which were not repositioning/resizing themselves correctly when the main LEAP form was maximized or docked to the top, left or right of the screen. Could result in gaps between the toolbar and other parts of the screen. Now fixed.
Fixes problem when using optimization calculations in conjunction with load shapes calculated endogenously for each demand device. Combining these options led to no dispatch of Transformation processes. Now fixed.
2018.1.30: 10/12/2019
Fixed a stack overflow crash that could occur when entering circular expression references.
Improved 64-bit scripting to make it more robust when calling user-defined functions.
Improved Help:About screen to gather more information about whether 64-bit scripting is properly installed and registered.
Made code more robust to handle situations when negative values raised to a fractional power.
2018.1.29: 10/7/2019
Fixed an error introduced in 2018.1.28 preventing selection of demand energy intensity units in Analysis View.
2018.1.28: 10/3/2019
Fixed an error when a model contained expressions with Interp, Step and similar time series values containing a final growth rate parameter. If the final parameter was specified as a reference to another variable, then a range check error occurred.
2018.1.27: 8/8/2019
Fixed issue in optimization calculations that could cause no processes to be dispatched.
Fixed problem with the Analysis View:Export to Excel option when computer set to use non-English format numbers. Caused values in Excel to be incorrectly scaled.
Fixed erroneous "not a valid number" error message in General:Units screen when computer set to use non-English format numbers.
2018.1.26: 7/18/2019
Fixed issue that caused an erroneous error message, when calculating certain Transformation modules using optimization methods.
Fixed issue causing optimization calculations to fail if LEAP was installed in a folder containing a user name with a non-English accented character.
Updated to use newer version of MapWinGIS component (5.0.2.2).
Added information on MapwinGIS component version being used by LEAP in Help: About screen.
Added a new dialog to ask if user wants to update an area saved in an older format, when opening that area. Previously, LEAP always updated areas without asking.
2018.1.25: 5/2/2019
Fixed problem with the General:Lifecycle Profiles screen (problem introduced in .24 version). Curve and constant parameters could not be edited.
Fixed problem with the "Insert Branches from Other Area" wizard. LEAP was incorrectly mapping dimensions such as scenarios, regions and effects between the source and destination areas.
2018.1.24: 4/15/2019
Fixed issues handling demand technologies specified with time-sliced-energy or time-sliced-power requirements. LEAP was also incorrectly allowing these methods to be mixed with branches where energy intensities were specified at the end-use level. This is now disallowed.
Fixed issues when handling read-only areas. Users were able to make changes to some data.
2018.1.23: 4/2/2019
Fixed bug in transport stock-turnover emissions calculations, in which result was incorrect if device used more than one fuel.
Fixed bug causing an error when adding land types. Error occurred after closing the Land Types screen.
Various minor changes to LEAP API to support selection of Results variables in the Results View (using LEAP.ActiveVariable) and to support selection of yearly intervals for displaying results (LEAP.ResultsViewYearlyInterval) and to select the Results view display tab (table, chart or split) using LEAP.ShowResultsViewTable, LEAP.ShowResultsViewChart and LEAP.ShowResultsViewSplit. Various improvements to API code to make selecting results more robust.
Improved red/green/blue color palette.
2018.1.22: 1/8/2019
Minor bug fix in stock turnover retirement calculations.
2018.1.20: 12/5/2018
Fixed bug that can occur after changing the fuel type in the General:Fuels screen. This may lead to an error message appearing in the main screen "Invalid fuel specified for device" and/or may cause corruption of the list of fuels under the Resource branches. Have also made the code that maintains the branches under the Resource branches more robust.
Fixed bug in API that caused an error when adding a Key Assumption branch via an API call.
2018.1.19: not released
2018.1.18: 9/7/2018
Fixed error where expressions get blanked out, appearing as zeros, after visiting some supporting screens such as the LifeCycle Profiles screen, or after using certain functions such as ReadFromExcel.
2018.1.18: 9/7/2018
Fixed error where expressions get blanked out, appearing as zeros, after visiting some supporting screens such as the LifeCycle Profiles screen, or after using certain functions such as ReadFromExcel.
2018.1.17: 8/9/2018
Fixed error when setting up maps in multi-region areas.
Minor cosmetic improvements to View Bar.
Fixed occasional error when cursor hovers over certain complex charts.
Updated chart component including one new color palette.
2018.1.16: 8/7/2018
Important Bug Fix: Fixed problem displaying Key Assumption and Indicator values in Results view. In some configurations, these results were being counted multiple times when more than one scenario was calculated (problem introduced in 2018.12). Note: problem did not affect other results or results depending upon key assumptions.
More flexible LEAP-IBC calculations: IBC now supports multi-year current accounts data and allows results to be shown for any yearly interval (including annually). Previous versions of IBC could only show results every 10 years. Note that when using IBC, the base year must still be 2010.
Greatly improved responsiveness when editing expressions. Delays also reduced when adding and deleting branches and in various other operations.
New ChangeIn function calculates the change in a value vs. a given year. Supports 5 different modes for calculating the change: 0=percent,1=absolute,2=ratio,3=growth,4=average annual change. For example, the expression ChangeIn(Key\Population, BaseYear, ciPercent) will calculate the percentage change in the population since the base year.
Expressions now support references to data values filtered by tag. Previously, only references to results variables could be filtered. You might use this function for example, to calculate the number of households using clean cooking stoves in different scenarios or regions. To do so, simply tag each clean cooking technology with the word "clean" and then create an indicator variable with the expression Demand\Households:Total Activity[Household, Tag=clean]. See simple example of this technique in the "Clean Cooking Example.leap" area available via menu option Area: Install: Install from Internet.
Improvements and fixes to the Function Wizard. Now supports the ChangeIn function and properly supports evaluation of constants. Fixes an error when pasting data into the Function Wizard data fields.
Improved Expression Builder operation. It now properly warns you if navigating to another part of LEAP when an expression in the Expression Builder has not been submitted. This feature was only partially working in previous versions.
Fixed occasional erroneous error messages about branches being hidden. These error messages were displayed after adding new indicator branches and in a few other situations.
Improved handling of results when calculating results for intervals greater than one year. LEAP was not showing base year results if the base year was not exactly divisible by the interval.
Fixed slow screen refresh when changing color palettes for certain results charts in large data sets.
Fixed display of time-sliced values in Analysis View tables when selecting the "timeslice values" display format. In some cases, LEAP was only displaying a single year of values, and the year was not being consistently selected.
Fixed unit conversion issues when referencing values from WEAP, using the WEAPValue function.
Fixed problem in the Time-Series wizard causing it to discard time series values after the end year.
Added recent emissions decomposition script into sample scripts distributed with LEAP.
Other minor bug fixes, updated help files and tips.
2018.1.15: Not Distributed
2018.1.14: 7/21/2018
Fixed error when showing results by tag (issue introduced in LEAP v2018.12).
Fixed error in IBC scripts when area name did not match top area branch name (issue introduced in LEAP v2018.12).
Improvements to diagnostics messages. Extra checking of expressions and improved formatting of diagnostic tables. Removed erroneous diagnostic message about module's producing too much energy.
Fixed units conversion issues when displaying total energy and time-sliced energy branch types in Analysis View.
Known issue: Note that LEAP does not currently support changing scale or units in a reference to a WEAP variable: For now, avoid changing units in these references.
Fixed issue where WEAP was referencing time-sliced results variables in LEAP. LEAP was returning the annual total value rather than the correct value for the first time slice.
Fixed issues when selecting comparison scenarios in the cost-benefit summary view.
Fixed issue in the cost-benefit summary view where non-energy costs were not being discounted and were not being correctly shown relative to the comparison scenario.
Fixed error when pasting/copying branches more than one time: after the first time, LEAP lost track of which branch to copy from.
2018.1.13: 7/12/2018
Minor bug fix: error reporting system was accidentally switched off in v.12.
wh
2018.1.12: 7/9/2018
Faster Results View charts and tables: now between 30% and 50% quicker. These changes also feed through to make the Overviews screen faster.
Improved handling of hidden branch/variables: Since v2018, a reference to a hidden branch/variable now causes an error to be reported "Referenced branch...is hidden" and calculations to be stopped. This is by design, but can cause error messages in some areas created with earlier versions of LEAP. A new option in the Basic Parameters:Calculations screen let's you allow references to hidden branch/variables. Such references will return a value of zero and cause a warning message to be added to the calculation diagnostics. See option "Allow references to hidden variables".
Renaming the top-Level (area) name branch: Up until now the top level tree branch has always taken the name of the LEAP Area and could not be edited. However, we have noticed that many users constructing a model of a particular place or country choose to name their LEAP areas with more complex names, for example reflecting the date, the user's initials or the status of the data set. This makes reporting ungainly and can cause problems when creating a reference to results at the top level branch (e.g. total social costs or total GHG emissions). The new version of LEAP now let's you edit the top level branch name to be any legal branch name. We recommend entering a country or place name. If you save the area with another name using the "Save As" function, the top level branch will remain the same.
Two new functions for LEAP's data definition language (thanks Jack for adding these first in WEAP!).
Choose returns the Nth value from a list of values. The function syntax is "Choose(Nth, Value1, Value2, ..., ValueN)". The first parameter is truncated and evaluated as an integer (N). LEAP then returns the Nth value from the list of remaining parameters. If N is greater than the number of listed values, the final value is returned. The function must contain at least 2 parameters: N and one or more values. N must be 1 or higher. Examples: Choose(3, 1, 22, 333, 4444) = 333 or Choose(10, 1, 22, 333, 4444) = 4444
InList returns true (1) if a test value occurs in a list of values. Otherwise, it returns false (0). The syntax is "InList(Test Value, Value1, Value2, ..., ValueN)". The function must contain at least 2 parameters: a test value and a list of one or more values to test against.
Further improvements to LEAP-WEAP linking:
Now checks to ensure that you are running the 32-bit version of LEAP, not the 64-bit version. WEAP is currently 32-bit only and cannot be linked to the 64-bit version of LEAP.
Minor interface changes to better inform you via the main screen titles when LEAP and WEAP are linked (and which area you are linked to).
Additional improvements to make linking process more robust.
Note: Both LEAP and WEAP now require the most up-to-date versions of each tool and will report an error if you try to link to an older version. This new version of LEAP now requires the current beta (test) version of WEAP. Contact Jack Sieber (info@weap21.org) to request this. A full public release of a new version of WEAP will be available in the next few weeks.
Fixed problems with the ScenarioValue and RegionValue functions: which were not working correctly with all variations of parameters. These functions have now been split into ScenarioValue/ScenarioValueOf and RegionValue/RegionValueOf variants to support situations when referencing values across scenarios and regions for the same or another branch. The "Of" variants are now used to reference other branches.
Maps: Fixed errors when trying to view results as maps and reduced time to refresh maps on screen in Results View.
Fixed: Results view chart/table: "Differences vs. Previous Year Values" not working.
Various other minor bug fixes.
Minor edits to LEAP Terms and Conditions to make them more transparent.
Updated help files to reflect new/revised functions.
2018.1.10: 6/30/2018
Various fixes for linking LEAP to it's sister tool, WEAP, for energy-water nexus analysis, as well as some interface improvements in Analysis View.
Fixed inability to reference certain LEAP results (e.g. Average Power Dispatched).
Added missing Transformation result variables into the LEAP and WEAP branch/variable selector screen.
Fixed inability to create references to non-time-sliced LEAP variables from expressions in time-sliced WEAP variables.
Fixed issue where an invalid reference to a LEAP variable (in WEAP) would cause LEAP to also report an error.
Fixed range error when referencing Total Final Energy Consumption variable.
Fixed problem in which Total Final Energy Consumption and Total Activity Level variables were not being updated when activity data changed.
Fixed occasional error when starting WEAP from LEAP. An update for WEAP is required to fully address this issue. Available soon from https://www.weap21.org.
Improved display of charts and tables in Analysis View. Total Final Energy Consumption and Total Activity Level variables are now more sticky: i.e. they remain displayed as you navigate through the tree and edit tables (so long as they remain relevant). LEAP also better remembers choice of units in these charts and tables.
Improved operation of error reporting system to avoid erroneous error messages that were incorrectly alerting that LEAP was frozen during tasks that take a very long time (such as long calculations or huge data import operations).
2018.1.9: 6/21/2018
Fixed bug in emissions calculations for multi-fuel vehicles, when using transport stock-turnover calculations. LEAP was not properly accounting for device shares.
Fixed display alignment problem for titles in Results view charts and tables, in cases where there were no valid results to display.
Fixed Historical/Scenario divider line, which wasn't appearing in Results view charts.
Fixed problems with API when adding branches: LEAP was not properly updating branch data and so was sometimes reporting that a newly added branch was hidden, even when it was visible.
Fixed problem when exporting module energy balance report to Excel.
2018.1.8: 3/21/2018
New or updated data for the IBC Impacts calculator for 28 countries: Algeria, Bangladesh, Benin, Burkina Faso, Cameroon, Chad, China, Colombia, Costa Rica, Djibouti, Equatorial Guinea, Gabon, Gambia, Ghana, Lesotho, Libya, Madagascar, Mauritania, Mauritius, Mozambique, Sao Tome and Principe, Senegal, Seychelles, Sierra Leone, Sudan, Swaziland, Tunisia, Zimbabwe
Fixed error when trying to delete a Transformation module.
Fixed error when creating a fuel as a copy of an existing fuel in the Fuels screen.
2018.1.7: 3/19/2018
Fixed an error when calculating models with optimized Transformation modules when using the CPLEX solver on a computer using non-English number formatting.
Updated the Help:About screen to use the new SEI logo. Visit the brand new Stockholm Environment Institute web site at www.sei.org
2018.1.6: 3/15/2018
Additional fix to address errors during calculation of some areas with optimized Transformation modules.
2018.1.5: 3/13/2018
Fixed error message related to opening some very old data sets. When calculating, LEAP sometimes displayed the message Variable "Optimize" (2232) is not present at branch "Transformation".
2018.1.4: 3/6/2018
Updated to use latest version of GLPK linear programming kit (GLPK v 4.64).
Various fixes to WEAP-LEAP connector code including fixing problems when using LEAP's branch/variable wizard to select variables from WEAP to include into LEAP. If you have problems connecting with WEAP, please contact weap@sei.org to request the latest beta release of WEAP.
Fixed range errors when showing pie charts with very large values (e.g. when setting fossil fuel reserves to "UNLIMITED")
Updated contact information for SEI in Help and About screens to use new SEI web site address www.sei.org.
2018.1.3: 2/28/2018
Improved Integration with IBC Extension. Areas are now checked for compatibility with IBC within LEAP before attempting to calculate an area. Use of IBC now controlled from the Basic Parameters screen. Also when using IBC the Advanced:Events screen is now disabled since IBC-related events are now hard-wired into LEAP.
IBC Now Supports Multi-regional/Multi-national LEAP Areas. You can now use IBC with multi-regional areas. For such areas, choose multi-national for the Area scale on the Basic Parameters: Scope & Scale screen, then select the countries corresponding to each region on the Regions screen. LEAP will inform you if IBC supports each selected country/region. FYI, we are also working on a new version of IBC that will also support sub-national multi-region modeling (e.g. regions representing a capital city and the rest of the country). Expected summer 2018.
Updated API with New Collections & Objects for Countries and Land Types. Countries is the collection of all possible countries or economies known by LEAP. Land types is the collection of all named land types as used in LEAP's new land-use change and forestry calculations. LEAP now contains a built-in database with basic data (names, two and three letter ISO codes, latitude, longitude, region code, etc.) for 206 countries and territories. The database also contains boolean variables describing whether the IBC extension works for each country for its PM2.5, and ozone health/vegetation calculations. The number of countries that IBC works with is currently about 70 but will increase in future releases of LEAP. As that happens this database will be updated. The "countries" API collection gives direct read-only access to the countries database.
Added Two new API functions to the Variable Object: Variable.ValueR and Variable.ValueRS. These function have been added to supplement the existing Variable.Value function that returned the value of a data or result value. The original function required you to set the LEAP.ActiveScenario and LEAP.ActiveRegion properties (in multi-region areas) before it was called. However, this was not possible if calling the functions during a calculation (e.g. as part of an Event script) since changing the global region or scenario is disallowed within calculations. The two new functions let you specify the region and scenario as parameters to the functions. Both functions also require you to specify a year, a unit and an optional filter.
Improved Integrated Debugging.Fixed various error reports so that the now correctly link back to the appropriate pages in the Basic Parameters screen. Also added better checking of the fuels, regions, and effects, databases prior to each calculation. If any errors are detected, LEAP will stop the calculation and give user the option to open those forms to fix the problem: placing the cursor on the problematic item that needs fixing.
Removed Option to Add IPCC Tier 1 Emission Factors at All Branches. While this option was convenient, we have decided to remove it because it tended to encourage users to insufficiently review the emission factors they added. This could be dangerous because the factors were chosen based on the names of the tree branches, so it would not work well for non-English language areas. You can still add sets of IPCC Tier 1 emission factors for each individual technology branch.
Fixed bug in 64-bit version that was causing the Advanced menu to be hidden and prevented scripting from working. A required external "DLL" file (tsc64.dll) was missing. This is now included in the main LEAP installation package. If using the 64-bit version we recommend do a full download and installation to ensure this component is properly registered. If you prefer to use the Help: Check for Updates feature to update to 2018.1.3, then you will need to manually register this DLL into Windows. To do so, first update LEAP, then open a command window by running cmd.exe from the Windows Start menu. Next, change directory to the Program Files\LEAP folder then issue command: regsvr32 tsc64.dll
Fixed bug when creating filtered references to results values in expressions, (e.g. when results were filtered by fuel).
Fixed bug causing error when reading intermediate OSeMOSYS results files when using optimization in 64-bit version of LEAP.
Fixed bug that stopped LEAP from honoring annual renewable resource yields. This typically caused resources like hydro or wind to appear as imports in energy balances regardless of the yield values entered. In addition, LEAP was not allowing users to specify yield values for biomass resources.
Fixed bug preventing copy and pasting time series data in columns from Excel to LEAP.
Fixed bug that prevented optimization calculations from working in 64-bit version of LEAP.
Fixed bug that prevented Remainder function returning correct value in Analysis view, immediately after a branch was created.
Added better checking of units and unit classes for variable references in LEAP expressions.
2018.1.2: 12/8/2017
First 64-Bit Version. The new 64-bit version of LEAP works just like the existing 32-bit version in all ways, except that it allows for the creation of huge LEAP models. You can download the 64-bit version from main download page of the LEAP web site. This version only runs on 64-bit versions of Windows. By contrast, the 32-bit version can be used on both 32-bit and 64-bit versions of Windows. Following standard Windows conventions, the 64-bit version is installed under the "Program Files\LEAP" folder, whereas the 32-bit version is installed under the "Program Files (x86)\LEAP folder. In general, unless you plan on developing huge models, we recommend that for now, you continue using the 32-bit version since it is slightly faster and has been more thoroughly road-tested. If you wish, you can install both versions on the same computer and even run them simultaneously. We plan to continue supporting both 32-bit and 64-bit versions.
New automated bug tracking system added. The older bug tracking system was not compatible with 64-bit code.
Fixed various display problems in the Overviews screen.
Demand branch properties screen. Final Energy intensities in Current Accounts option was always disabled.
The Regions and Region Groups menu items were not visible in single region areas.
Updated installation program so that the required Visual C++ redistributables are now included in the setup program (i.e. they are no longer downloaded on demand). This makes installation usable when user has no internet access.
2018.1.0: 11/30/2017
LEAP 2018 brings major new capabilities including:
A New Integrated Benefits Calculator (IBC) for estimating health (mortality), ecosystem (crop loss) and climate (temperature change) impacts of your LEAP scenarios. IBC is particularly useful for examining the multiple benefits of taking coordinated action on long-lived and short-lived climate pollutants (SLCPs) and local air pollutants.
Modeling of Land-use Change, Forestry, and Land-based Resources: These new features can currently be used to assess Biomass Energy Strategies of the type currently being conducted in a number of African countries, and they also form a foundation for future updates that will support land-use change and forestry sector greenhouse gas mitigation assessment.
New map-based results visualization capabilities, to help users visually explore the geographic implications of their scenarios.
A 64-bit version for huge LEAP models.
Improved stakeholder interactions through an upgraded Overviews screen, and
Many other improvements to LEAP's modeling capabilities that make it more powerful and easier to use.
Details below...
IBC: The Integrated Benefits Calculator LEAP 2018 includes the new Integrated Benefits Calculator (IBC).This new add-on module to LEAP can be used to translate LEAP's existing emissions scenarios into estimates of health (mortality), ecosystem (crop loss) and climate (temperature change) impacts. The tool is particularly useful for examining the multiple benefits of taking coordinated action on long-lived and short-lived climate pollutants (SLCPs) and local air pollutants.
Land-Use Change, Forestry, and Land-Based Resource Modeling: LEAP 2018 includes major new capabilities for modeling resources based on an assessment of land-use and land-use change. These new features can currently be used to assess Biomass Energy Strategies (BESTs) of the type currently being conducted in a number of African countries, and form a foundation for future updates that will allow LEAP to be used for land-use change and forestry sector greenhouse gas mitigation assessment.
Improved Results Visualization Using Maps. Results for multi-regional data sets can now be visualized on maps including gradient maps and maps showing bar and pie charts. A new mapping engine is now included as part of the standard LEAP installation package, meaning it no longer needs to be separately installed, and sample maps are included in the standard distribution to help you get started. The ability to show maps is limited to multi-region LEAP areas. To use maps, use the General: Basic Parameters screen to first specify a standard ESRI shape file that should contains shapes corresponding to the regions of your Area. Next, in the General: Regions screen, you can specify how your regions in LEAP are mapped to the shapes in the Shape file. Once the mapping is set up, you will be able to access three new types of charts in Results View: Gradient Maps, Maps with Bar Charts and Maps with Pie Charts.
Improved Overviews Screen for Better Stakeholder Interactions.The Overviews screen, used to support stakeholder dialogue and interactive experimentation with LEAP models, has been redesigned. To help structure their conversations with stakeholders, model designers can now create alternative overviews containing different favorite charts and different "key Assumption" policy levers. Within an overview, users can override the standard favorite charts so as see how results differ among regions (in multi-regional areas) and scenarios.
64-Bit Code for Huge LEAP Models. Some users with very large LEAP models have experienced out of memory errors in the current 32 bit-only version of LEAP. LEAP2018 will be available in both 32-bit and 64-bit versions (64-bit version coming in a few weeks). The 64-bit version, which also requires a 64-bit version of Windows 7 or later, supports huge LEAP models. 32-bit programs are limited to about 2 GB of memory use, while 64-bit programs can use up to 192 GB of RAM in Windows 7 Pro.
Improved Wizards for Easier Model Design. The Branch/Variable Wizard, used to create relationships between variables in LEAP models, now supports filtering of results. For example, you might use it to specify that the cost of solar energy is expected to decrease as the installed capacity of solar power increases. You can create an expression in LEAP to do this using the new improved Lookup function (see below) and using the Branch/Variable wizard to create a reference to the installed capacity of solar energy.
New Features to Support Moving Data Among Data Sets. As more people use LEAP for different types of analyses it has become increasingly important to support moving data between models. For example, you might want to take a detailed transportation analysis from one model and include it in an overall integrated mitigation model. LEAP 2018 helps with these tasks by now supporting copying and pasting branches between two open instances of LEAP. The "Insert branches from another area" wizard has been streamlined and made more robust. It now automatically scans source and destination areas and, in cases where a dimension has no new elements in the destination area, it will not ask about mapping those dimensions. This makes the whole process much faster and simpler.
Better Modeling Flexibility. Various modeling variables (such as those used to model Transformation output fuels and those used to model "unmet requirements" for resources) are now fully expression-based, rather than being static properties of a branch. This provides greater modeling flexibility and gives a more consistent user interface, while also providing for better support via the API.
Simplified User Interface. Significant efforts have been made to simplify the user interface. Thus, while LEAP2018 is more powerful than past versions, we believe it is also significantly easier to use. Examples include:
Removing the special options for copying/pasting branches. This functionality is now incorporated within the standard copy/paste options and the Ctrl+C/Ctrl+V key.
Unified options for adding environmental effects on the tree. The old toolbar for adding effects on the right of table for "Environmental Loadings" is now removed, and is replaced by the standard add/delete buttons shown above the tree in the Analysis View.
The General: Basic Parameters screen has been simplified with the number of tabs reduced from 13 in LEAP2017 to eight in LEAP2018. Many options have been moved to the places where they are most used. For example, advanced chart settings can now be accessed directly within the Results View screen via the advanced settings button, while default units can now be specified from with the General: Units screen. By default, LEAP now also saves all results variables and the General: Results to Save screen is now hidden by default. This avoids confusion about why certain results may not be being calculated. You can still choose to save only selected results by choosing "Selected Results" on the Basic Parameters: Scope & Scale screen. This makes calculations faster and reduces the complexity of the Results view.
Improved Emissions Modeling. Multiple similar pollutant effect loadings can now be specified for a single technology. For example, you might specify one emission factor for energy-related CO2 emissions from cement manufacture and another for process-related CO2 emissions.
Hiding of Branches in a Single-Region Area. Branches can now be hidden even in a single region area. Hidden branches are not included in LEAP's calculations, so do not form part of the results shown in the Results, Energy Balances, Summaries and Overviews views. You can use this feature to temporarily exclude certain branches from calculations. You can show and hide branches by right-clicking on a branch in the tree view or by using the special "Select Visible Branches" screen that lets you edit the visibility of all branches (available via a button above the tree). We have improved this screen: for example by adding a "find next hidden branch" option and adding a status message to show how many branches are hidden in each region. Expressions now report an error if an expression references a hidden branch.
Improved Lifecycle Profiles. The Lifecycle profiles screen, used to specify transportation and other stock turnover models and to specify harvesting regimes in the new land use-based resource calculations, has been improved. It now includes options to duplicate existing profiles with a new name, and to normalize profiles to sum to 100%. In addition, lifecycle profiles used in your LEAP models can now vary by region for a given branch and variable.
Improved Handling of Links to Excel. LEAP now has faster and more robust links to data stored in Excel sheets. In particular, when an area containing linked Excel sheets is sent from one user to another (or copied from one PC to another), the cached Excel data will be preserved making initial calculations much faster.
Improvements to LEAP's Expression-based Data Definition Language. Various new functions have been added or made more flexible. A new Lookup function supports both linear and step-wise lookups, and improved ScenarioValue and RegionValue functions now support references to other branches and variables. Variable references have also been improved. You can now reference variables at branches above where they are defined. Previously this returned an error message. LEAP now returns the sum of all occurrences of the variable in descendant branches. If no descendant branches contains the variable, then an error will still be generated. Results references can now filter results based on almost any dimension (not just fuels, effects, regions, tags). References to result variables are now resolved without explicitly showing branch names (making them more readable). Handling of filtering errors has also been improved.
Faster Operation. Numerous improvements have been made to speed up the user interface, including faster showing, hiding and reordering of branches.
Other Improvements. Other improvements include better Results View design and improved display of "avoided" results and "unmet requirements". These now always show as the first series in charts and tables, regardless of the names of other branches. Other improvements include better handling of events script file names when moving areas between computers, and various bug fixes and improvements to the API. In addition, we have made improvements to better support importing data from Excel when using non-English numbering & list formatting and to better support copying and pasting data from Excel. Finally, we have fixed some important bugs that affected parsing of complex expressions with multiple nested parameters.
Updated User Guide. The integrated context-sensitive help system (and the web-based version) have been updated to reflect all of the above the new features.
IBC uses parameterized results from the global atmospheric geochemistry model GeosChem-Adjoint, which translates emissions of primary pollutants from a country into population-weighted concentrations of secondary pollutants including ozone, black carbon, organic carbon, ammonia and particulates (PM2.5). These concentrations are then used in standard concentration-response functions to calculate estimates of mortality and crop losses. Results can be disaggregated in a number of ways including by the source of the emissions (in-country, natural background and emissions from the rest of the world), by the pollutant causing the impact, or by age group (for mortality) or by crop type (for crop losses). The system currently covers four common crops (wheat, rice, maize and soy). Health impact functions are based on the standard dose-response functions used in the recent Global Burden of Disease Study (ref). GeosChem-Adjoint is a global 3-D chemical transport model for atmospheric composition driven by meteorological input from the Goddard Earth Observing System (GEOS) of NASA and is based on emissions inventories from the EDGAR database.
IBC runs are based on emissions inventories and projections developed in LEAP. Users are required to specify comprehensive emissions inventories and forward-looking scenarios for key pollutants including CO2, PM2.5, methane, black carbon, organic carbon, NMVOCs, NOx and ammonia. SEI has developed a comprehensive set of default emission factors for these pollutants, which users can add in to their existing data sets. This can be useful if a country has already developed a LEAP data set for its analysis of its Nationally Determined Contributions (NDCs). Alternatively, we have also developed a comprehensive template for performing these types of analysis (included in LEAP 2018). This focuses on sectors that are important in terms of generating emissions of important SLCPs (such as emissions from brick kilns, diesel vehicles, traditional cook stoves or agricultural practices such as residue burning and methane from manure). Users can also opt to merge their existing data sets with parts of this template, to create a data set that meets the needs of their particular country. A sample data set named "Asiana", included with LEAP2018, illustrates how LEAP can be used to examine how alternative policies and measures that can mitigate both short- and long-lived climate pollutants, and reduce the health and ecosystem impacts associated with air pollution. The national-scale emissions scenarios generated in LEAP are combined with estimates of emissions of air pollutants for the rest of the world for the period 1990-2050, taken from the global ECLIPSE scenarios developed by IIASA. Two scenarios are included. A baseline scenario that foresees only minor worldwide efforts to combat air pollution, and a maximal effort scenario that reflects full implementation of 16 measures including the banning of agricultural residue burning. LEAP users can conduct sensitivity analyses to see the effect of differing levels of effort in the rest of the world on the impacts experienced in their own country.
IBC is notable because, for the first time, it makes a complex and highly computing-intensive modeling methodology readily accessible to planners in developing countries. By first parameterizing the calculations of GeosChem-Adjoint (which can take a few days to perform per country, even on super computers), the calculations in LEAP can then be run in just a few seconds. Moreover, LEAP is used for all data management and results visualization, making it readily usable by developing country planners. Previously, such analyses could only be done by highly experienced modelers working in large international institutions.
Currently, LEAP-IBC works for a selected set of national-scale applications. It has so far been calibrated to work for 71 countries for PM2.5, and 20 countries for Ozone-related impacts. We plan to expand this coverage to about 150 countries in 2018 (as part of a forthcoming release of LEAP). A second version of the IBC tool is planned that can be applied at the city scale, and which will provide greater information on the impacts of indoor air pollution, including gender-based disaggregation of impacts.
)

These new capabilities are built upon a new set of screens that allow users to account for land-use in each region of their country and to describe alternative scenarios for land-use change by specifying land conversions from one type to another. These conversions can be used to account for changes such as deforestation caused by logging, expansion of agricultural lands, or reforestation and upgrading of the productivity of certain land types. LEAP can even track the supplies of wood generated by land clearances.
Land-use change scenarios form the basis for optionally specifying the availability of resources per unit of land area. This approach can be used to examine the availability of wood and other biomass energy resources, and can also be used to assess any disaggregated renewable resources such as wind or solar energy. When used for biomass energy strategies, LEAP can examine the detailed interactions between the demands for wood fuels in each region, including both direct energy and non-energy-related consumption of wood, and indirect demands for wood for making charcoal. It can also consider the transport of wood fuels among the regions of an area and between the area and the rest of the world. These requirements for wood can then be compared to supplies of wood coming from each land-type on each area. LEAP is also able to model different types of wood supplies including sustainable supplies from informally managed land types, supplies from land clearances (as a result of land-use conversions), supplies from formal wood lots managed on a set harvesting regime, and short-term supplies from unsustainable cutting of wood stocks on informally managed lands. Outputs include estimates of wood supplies as well as the changes in wood stocks over time in each scenario. LEAP also considers how different land areas will have different levels of accessibility, so that wood in some land areas will not be cut regardless of demands, reflecting how some areas are protected or inaccessible. Results can be visualized in LEAP's Results view as charts, tables and maps.
All of these new capabilities are optional, but note that this type of analysis works best with multi-regional LEAP areas.To switch them on, go to the Basic Parameters: Scope screen and switch on Land-Use Change and Land-Based Resources. Next, use the new General: Land Types screen to define the land types that exist in a given area. Once you have defined a set of land-types you can also go into the General: Fuels screen and specify the primary fuels, for which you wish to specify resource availability disaggregated by land type. Place check marks in the "By Land Type" column next to relevant fuels. Once you have followed these two steps, you can return to the Analysis View and there you will see a number of new branches in the Tree. One high level branch is labeled "Land Areas". Under this branch, you will see a category branch named "Land types" as well as branches for each land type. Here, you can specify the base year land area inventory for each region. You will also see a category branch labeled "Land Conversions", under which you can specify future land-type conversions from one land type to another. Under the Resources branches, for those fuels that you chose to specify by land type, you can specify a series of variables describing the base year stocks, growth rates, accessibility and management practices used in each land type and each region. All of the data required can be specified using LEAP's standard expression-based data definition language.


LEAP 2017
2017.0.11: 6/1/2017
Minor fixes to Overviews screen: Charts were sometimes not updating when sliders dragged if attached values small.
Fixed code that checked for conflicting use of scenarios in cost of saved energy calculations.
2017.0.10: 5/19/2017
Fixed bug when referencing certain results variables.
Fixed bug when double-clicking a branch/variable reference to edit it in a popup window: LEAP was not recognizing some valid references and valid units, and was sometimes discarding the edited reference in the main data grid after it was submitted.
2017.0.9: 5/4/2017
Updated core data for LEAP-IBC.
Fixes error in crop loss calculations if zero crops produced.
2017.0.8: 4/26/2017
Fixes importing and exporting data to/from Excel when PC is configured with non-English number formatting.
Additional minor fixes in various supporting screens to better handle Escape key pressses in selection boxes, and prevent closing of whole form.
2017.0.7: 4/18/2017
Fixed bug in API that returned the wrong value for the Branch.Index property.
2017.0.6: 4/11/2017
Fixed bug in capital costs calculation in optimization scenarios (bug introduced in 2017.0.5).
Made code more robust in situations where expressions were referencing deleted branches or variables.
Improved error reporting when referencing moved or deleted user variables or in cases where user variable was not valid in a scenario.
Updated data for (experimental) IBC module: now also covers Togo.
Improved Transformation module properties screen (simpler layout, added hints)
Improved error checking and reporting for variables used in optimization calculations. In particular, changing the "optimize" setting was not immediately updating the list of variables associated with processes to reflect this change.
New digital signatures of LEAP executable files, valid to 2020.
2017.0.5: 2/8/2017
Mainly bug fixes in this release:
Fixed double-counting of Transformation Capital Costs in multi-region models.
LEAP calculations could result in an error if a data set included a stock turnover technology branch and CSE costs at category branches. You can now specify CSE costs at higher level branches, but take care not to double-count costs if entering CSE costs at both higher and lower level demand branches.
Fixed problems displaying "wedge" charts: X axis values were not being displayed correctly.
Fixed bug when choosing dispatch rules or yearly shapes from drop down menu attached to expression field (on the orange "E" button) - Selected values were lost after exiting the edited field.
Fixed GetBrushPen error in fuels and effects screens when switching between Fuels/Effects used in Current Area versus All Fuels/All Effects.
Fixed various "cannot focus window" error messages that could occur when switching among LEAP and other programs.
Fixed bug affecting display of yearly shape charts when using a peak load shape profile. Chart did not correctly cross Y axis at 100% of peak load. Also fixed problems with names/values of time slices in some saved versions of the Freedonia data set.
The Windows Alt-Tab app switching screen was sometimes not showing the LEAP program icon. Screens in LEAP that used small "toolbar" borders (e.g. the Time-series wizard) were causing it to be hidden. This is by-design in Windows, but can be confusing and frustrating. To avoid this problem, LEAP now always uses standard sized window borders.
Fixed errors when running LEAP under Wine (e.g. on Apple or Linux Computers). Note that LEAP is not officially supported under Wine and we do not recommend using it in this configuration as many features are inoperable.
Minor cosmetic improvements in Basic Parameters: fixed problems with transparency of controls affecting LEAP running on older versions of Windows.
Various bug fixes in the Summaries view.
Bug fix: An error message was displayed if you removed cost data from a Transformation Module Properties screen when the module was set to use optimization calculations.
Fixed display problems with costing results charts, when branches were selected in the chart legend.
Updated terms and conditions for LEAP use with new text as follows: "You may not integrate LEAP into any multi-user, client-server or web-based application without prior explicit written permission from SEI". You must review and accept the license agreement again if you wish to use this new version.
LEAP update feature was sometimes locking-up while downloading an update. Updated code to avoid this issue.
Updated jump list when right-clicking LEAP icon in Windows taskbar - to reflect removal of old Diagram view and to show new LEAP web site.
Now uses new LEAP web server for shared areas and for subsequent LEAP update files.
2017.0.4: 12/20/2016
Forgot to update data file version number in 2017.0.3: this could cause an error when viewing results unless you forced a recalculation. Sorry!
2017.0.3: 12/20/2016
Fixed Bug: List of tabs (variables) for Transformation processes in Analysis View not being properly updated when switching between optimization/non-optimization scenarios.
Fixed Bug: Social cost-benefit calculations were not correctly reflecting the cost-benefit boundary set in the Basic Parameters: Costing screen.
Fixed additional bugs in handling of the fuel named "non energy". In some data sets, energy balances and other reports were conflating results for electricity vs. non energy use.
Fixed problems in setting co-product properties of useful energy technologies. Also, "non energy" was not selectable as a valid co-product for useful energy technologies.
Added "Useful Energy Demands" and "Primary Requirements Allocated to Demands" as results that can be referenced in expressions in the Builder tool and elsewhere.
Fixed issue where some check boxes in the "Results to Save" screen became unchecked after visiting the Basic Parameters screen.
Fixed bug preventing Sankey Diagram drawing if there were unmet requirements.
Minor updates to Basic Parameters to reduce screen clutter and provide better hints on variables.
2017.0.2: 12/9/2016
Bug fix: color palette selection not working properly in supporting screens.
2017.0.1: 12/8/2016
LEAP 2017 focuses on improved results visualization and modeling flexibility based on significant upgrades to LEAP's "Tagging" capabilities. We have also worked on overall software quality, with a large number of bug fixes made possible in part by LEAP's new bug tracking system, which has let us monitor and then fix the most common problem that users are facing. We hope you will find this new version significantly more robust and powerful.
1. Improved Tagging Capabilities:
- Using Tags in Results Reports:
In past LEAP versions, when displaying results in charts and tables
you could display results organized by the branch names in the LEAP tree. In
large data sets the number of items in the tree would often be very high,
making it hard to visualize important information and trends. These
limitations have been overcome in this new version of LEAP. Now, you can use
tags associated with branches as an additional dimension in your results.
This gives you a new level of flexibility in the types charts and tables you
can create.
To use tags in your reports, follow these few basic guidelines. Firstly, in the Tag Manager screen (Alt-T or accessible from the new Tags main menu option) create groups of tags and make sure that all tags are assigned to a tag group. For example, you might assign tags to power plants indicating if they are "Existing" or "New" power plants. Both of these tags could be assigned to a tag group named "Status". When adding tags to branches in the tree (using the tag toolbar shown below the Tree), make sure that any branch contains no more than one tag from each Tag Group. LEAP will warn you if you try to add both of these tags to the same branch.
Once you have followed these steps, tags will automatically appear as an additional selectable dimension in your Results View charts and tables. When you select tags as a dimension, an additional selection box will appear in the Results View toolbar (at the top of screen) which you can use to select a Tag Group. You can display results by tag for any one tag group at a time. When displaying results, LEAP will automatically warn you if any branches have multiple clashing tags, since this situation would otherwise lead to double-counting of results. - Improved Results Visualization: To further enhance results interpretation, when showing results with tags or branches selected for the chart legend, LEAP can now color code the tree branches using the same colors used in the chart. This make is easy to see how the results in the chart correspond to the branches in the tree (or the tags set at those branches). In addition, when displaying branches on a chart legend, LEAP will now automatically expand the tree branches to show the color coded branches corresponding to the items in your chart. You can switch color coding of the tree on and off using the new View: Color Tree Branches menu option (accessible when in Results View).
These two new features are illustrated together in the figures shown below. In Figure 1, results for electric generation (TWh) are organized by branch (in the chart legend) as was the practice in older versions of LEAP. Notice that this chart is quite hard to interpret because it contains such a long list of branches. In Figure 2 we have selected tags as the dimension for the chart legend, and then selected tag group "Status" at the top of the screen. We have also switched on the new "Color Tree Branches" option. Notice how much easier it is to interpret the results for "new" vs. "existing" power plants, both because the number of items in the chart is much smaller, and also because the tree is color coded to match the chart. In Figure 3 we select another tag group showing exactly the same results but now grouped according to the type of technology (steam turbine, combined cycle, combustion turbine, hydro, wind, solar, etc.). Bear in mind that these groupings are flexible: you can create as many tags and as many tag groups as you wish. Figure 4 shows one more type of chart using tags. In this case, results are grouped by "renewability" tags: fossil vs. nuclear vs. hydro vs. other types of renewables.


2. Other Tagging Upgrades
-
Using Tags in Result References in Expressions: You can now use tags to filter the result references in your expressions. For example, you might reference the total power generation from all renewable generation as follows:
-
Improved Tag Toolbar: The Tag toolbar at the foot of the tree in the Analysis View has been improved, making it more robust and easier to use. It includes most of the options accessible from "Tags" menu. It can also be shown or hidden via an option on the Tags menu.
-
New Tags Main Menu Option: A new main menu option has been added named "Tags (Alt-S)" in the Analysis View giving access to all the various options for managing tags including the overall Tag Manager screen. It includes a Tag Painting capability and settings that let you control the adding and replacing of tags. It also includes two new options for exporting and importing all branch tags to and from Excel as well as an option for deleting all branch tags. The menu also let's you color the tree branches in Analysis View based on the colors assigned to different groups of tags.
-
Tag Filter Toolbar Removed: Now that tags are integrated as an extra dimension in LEAP results, the tag filter toolbar previously used in Results view has been removed. Its functionality has now been subsumed into the wider tags-as-dimension capability. You can filter reports by tag even when tags are not a dimension on the chart X-axis or legend by using the Tag selection box that now appears in the Results View toolbar. One cautionary note: if you filter a report by tag, but that report is for branches that have none of the selected tags, then no chart or table will be shown.
-
Improved Tag Manager: The Tag Manager (Alt-T) now gives you information on how many branches are tagged with each tag and how many tags are in each tag group. It also lets you filter the list of tags by Tag Group. We have removed the ability to individually choose colors for Tags since this feature provided only a very limited number of color choices. Tag colors can now be quickly set by using the same color palettes used elsewhere in LEAP (see above).
Electricity Generation\Processes:Outputs by Output Fuel[GWh, Tag=renewable]
You can also now include the not equals sign "<>" in an expression filter to filter results to exclude certain elements. For example, to see generation from non-renewable power plants you could write:
Electricity Generation\Processes:Outputs by Output Fuel[GWh, Tag<>renewable]
3. Overall Quality Improvements
For LEAP 2017 we have also focused on overall software quality with a large number of bug fixes, made possible in part by our recently implemented automatic bug tracking system, which allows us to monitor and then fix the most common problems that users are facing. We believe these changes will make LEAP more robust. Here is the detailed list of changes:
Using LEAP with WEAP. Fixed various issues when using LEAP in conjunction with its sister tool WEAP (for water resource planning) and made the LEAP-WEAP connection more robust. If using WEAP with this new version of LEAP, please contact the WEAP support team (info@weap21.org) to get a new (beta) version of WEAP. Note that the current public version of WEAP does not (yet) work properly with LEAP 2017. LEAP and WEAP also now are more careful about checking that a required minimum version of their sister tool is present.
Fixed errors when using Time-Series Wizard, when using the lifecycle profiles screen and when adding or deleting Endogenous Capacity data.
Fixed most common range check and access violation errors.
Added missing pop up menus in various supporting screens.
Properly handles external OLE errors caused by trying to export to a busy or unavailable external application using OLE (e.g. exporting to Excel if in edit mode). No longer causes a LEAP error: instead gives guidance on checking the external application.
Fixed various errors in supporting screens when working in a Non-English language.
Properly handles issues when entering various screens if no default printer has been set in the Windows "Devices and Printers" screen. No longer causes a LEAP error: instead gives guidance on how to set a default printer.
Improved editing in supporting screens and tables: Now properly handles read-only fields; better support for copy and paste operations including better diagnostic messages if unable to handle pasted data; better validation of values in supporting screens (e.g. checks chemical compositions in Fuel screen, disallows blank values); properly supports Tab key within all data entry tables; better checks to prevent certain actions being used when actively editing data in tables; now properly handles attempts to enter invalid data into numeric fields without causing a LEAP error; added ability to adjust number of decimal places in fuels screen; now shows zero values as dashes to reduce on-screen clutter. Fixes display issue in Effects screen when no effects used in area.
Bug fix affecting the Scenarios API collection. The notation Scenarios(1).Name was not working correctly.
Fixed problems in Transformation when setting up processes to use the fuel named "non-energy".
Tightened rules for naming elements such as constants, units, fuels, tags, effects, scenarios etc. Now prevents using reserved words. Better checks for duplicate names. Disallows blank names.
Improved Support for Non-GHG Pollutants: Result references now support individual pollutant emissions, which may be measured in different units. Previously, only effects measured in mass units (e.g. kg) could be referenced. When referencing non-GHG pollution emissions, you must include an "Effect=" filter in your reference (e.g. Effect=NOx).
Fixed problem with chart series appearing inverted when years dimension placed on the chart legend.
Minor cosmetic change: updated icon for effects (pollutants).
Fixed occasional error in Sankey diagram when handling fuels where tiny quantities are wasted.
Help files and sample data sets have also been updated to reflect the changes in LEAP 2017.
LEAP 2015
2015.0.30: 11/13/2016
Improved Script Editor: The built-in LEAP script editor has been improved to show more useful information on Application Programming Interface (API) objects including help text, whether an object is a method or a property, the type of the return object, and whether it is read-only or read/write (can be edited). Note that some of the less-used objects may be specified as read/write but trying to set their values may return a "not implemented yet" error.
Support for Multiple Scripting/Programming Languages: The script editor has been improved to now support multiple windows scripting languages. Previously it only supported BASIC (VBScript) files (.vbs, .vbe, .vb and .bas files). It now also supports JScript (a variant of Javascript with .js or .jscript files), Python (.pys) and Perl (.pls). The styling features of the script editor automatically adjust to support each of these languages once a scripting file is opened or created. The language is detected automatically when you open one of these files based on its extension. Note that most recent versions of Windows support VBScript and JScript by default. Other Windows Scripting Languages including Python and Perl typically need to be installed separately. Information on scripting languages and how to download them here.
New Capabilities and Bug Fixes for the LEAP API: If you make use of the API, please make sure you re-register the API after installing or updating LEAP. You can do that by running the "RegisterLEAP.BAT" file in the LEAP program folder.
Improvements to the API include:
Scenarios: Added capabilities to change scenario names and abbreviations and to list, add, remove and reorder the "additional" inherited scenarios that are used when combining scenarios into overall integrated scenarios. For more information, open the Advanced:Edit Scripts screen and see the properties and methods of the "Scenario" objects. The new properties and methods include: AdditionalScenarios (a collection of the additional scenarios associated with each scenario), AddAdditional, RemoveAdditional, PromoteAdditional and DemoteAdditional.
Tags: The API's for managing tags have been updated and improved so that you can now use the API to add and remove tags at LEAP branches. Use the Branch.Tags property to get the list of tags at a given branch and use the Tags.Add and Tags.Delete methods to add and remove tags either from the overall area-wide list of tags or from the list of tags defined at a particular branch.
Tag Groups: A new TagGroups collection contains the names used to categorize tags. You can also access the TagGroup object associated with each tag as a property of a tag object.
Fuel and Region groups: The API has been extended to include new collections of the fuel and region groupings. There can be up to 4 sets each of region and fuel groupings. Use the LEAP.NumFuelGroupSets and LEAP.NumRegionGroupSets properties to find out how many sets have been defined in an area. Use the LEAP.FuelGroupSets(index) and LEAP.FuelRegionSets(index) properties to access the actual collections of fuel groupings. You can also access the grouping items associated with each fuel using the Fuel.Grouping(index) and Region.Grouping(index) properties.
The API has also been extended in other ways, for example to support the "Exists" method in most collections and to hide older deprecated methods.
Note that some methods and properties have been removed for better overall consistency. For example, the LEAP.Fuel, LEAP.Region, LEAP.Scenario and similar functions have been removed since they are duplicated by the LEAP.Fuels, LEAP.Regions, LEAP.Scenarios functions etc. If you try to use these obsolete functions, an error message will be displayed. Use the script editor to get a detailed enumeration of all API collections and objects. Use the panel on the right hand side of the script editor to get detailed help on each object.
Fixed bug where LEAP could crash if trying to install an area by double-clicking a ".leap" file when a modal supporting screen (e.g Fuels, Effects, Basic Parameters etc.) was open.
Stopped relevant API functions operating when modal supporting screens are open.
Fixed errors in The Script Editor screen when cutting or pasting text.
Updated fuel and region grouping screens to reflect terminology changes and to better validate set names.
Updated help files to reflect API and other changes.
Various bug fixes in the Overviews screen, and the Insert Branches from Another Area screen .
Known Issue: This new version of LEAP is not yet compatible with the current version of WEAP. We are working to update LEAP and WEAP so their API's work together correctly. Stay tuned for updates to WEAP and LEAP to resolve these issues in the next few weeks.
2015.0.29: 10/26/2016
Fixed two bugs affecting accounting for auxiliary fuel use.
Fixed bug causing range errors in calculations if energy sector effect loadings were not enabled on the Basic Parameters screen.
Updated core data for experimental LEAP-IBC module. Added data for 5 more countries: Indonesia, Kenya, Nepal, Philippines, Thailand.
IBC now covers 24 countries: Argentina, Bangladesh, Bolivia, Brazil, Côte d'Ivoire, Chile, China, Colombia, Dominican Republic, Ecuador, Estonia, Ghana, Indonesia, Kenya, Morocco, Mexico, Nepal, Nigeria, Peru, Paraguay, Philippines, Thailand, Uruguay, and Venezuela.Fixed bug in Overviews screen that caused charts showing emissions to sometimes show results for the wrong pollutant.
2015.0.28: 10/11/2016
Improved Import from Excel/Export to Excel functions: These now have more robust error checking and better diagnostic messages during importing - for example, properly handling Excel cells containing invalid LEAP expressions. Have also fixed the option to import as links to expressions stored in Excel using the "Excel" function. A new dialog box allows you to cancel import entirely, skip one invalid cell or skip all invalid cells when an error is detected.
Scenario Expressions: Redesigned the "Show Scenario Branches" dialog on the Tree menu and renamed it "Scenario Expressions". The new screen now shows both branches and variables (and also the regions in a multi-region model) where expressions are explicitly entered in a scenario (those shown in blue text). The screen is now non-modal (i.e it stays open until explicitly closed). This lets you jump to expressions in Analysis View without having to continually open and close the dialog. A new toolbar lets you filter the list of expressions by variable or by region. More information here.
Insert Branches from Another Area: Redesigned the "Insert Branches From Folder" option on the Tree menu to make it more powerful, flexible and easier to use. It has also been renamed to become "Insert Branches from Another Area". This feature has been improved in a number of ways:
Rather than only working for Demand and Key Assumption branches (as it did previously) , you can now import Demand branches, Key Assumption branches, Transformation modules, Non-Energy branches and Indicator branches.
You can now flexibly map the data to be imported from a source area to a destination area. Previously this feature could not import user variables or tags and required regions, effects and units to be exactly the same in both areas. Now, you can flexibly map scenarios, user variables, fuels, regions, effects, units and tags between the source area and the destination area.
A new introductory screen lets you quickly set up the import process. On it you can now quickly select the area to be imported (without having to use a complex file selection dialog) and then set import options across all items (scenarios, user variables, regions, fuels, effects, units and tags). You can choose to add all missing items, not import missing items, or choose customized mappings for each individual item. This screen also lets you choose to import only data structures (i.e. not import any expressions). A second screen is used to pick the branches to be imported.
A redesigned mapping screen lets you customize how you want to map individual items between source and destination areas. You can also add in missing items, or choose not to import certain items. The redesigned screen also lets you search for items, use LEAP's "ditto" function (Ctrl+D) to copy values from the prior record, or set all items to be imported or not imported.
The importing process is now more robust and does a better job of handling Key Assumptions. When importing these, it will give you the option to update/override any key assumptions with the same path names in the source and destination areas. A dialog box lets you choose to update one or all key assumptions or create new branches in the destination area where duplicate names exist. The import process also now handles user variables and tags. Taken together, all these changes improve the importing of data and expressions from one area to another.
Finally, a summary screen is shown at the end of the importing process to summarize the data that has been imported. The help files for the "Import Branches from Another Area" option have also been thoroughly updated.
Fixed crashes when running two or more instances of LEAP.
Fixed various bugs in the Summaries view, especially related to switching columns and sumary reports, and made more robust.
Fixed various error messages during Backup, while adding a scenario, while adding or deleting endogenous capacity additions and while adding environmental loadings. These were caused by the recent speed enhancements.
Fixed an error when opening some Areas that was caused by orphaned/deleted branches that are still being referenced in the Overviews screen.
Fixed socket error when connecting to SEI FTP servers to download and install a LEAP Area (Area: Install: Install from the Internet).
Updated help file to include information on new "Scenario Expressions" and "Insert Branches from Another Area" screens.
2015.0.27: 9/7/2016
Fixed expression-parsing errors while calculating some LEAP areas, caused by recent code optimizations in v2015.0.25.
2015.0.26: 9/6/2016
Fixed a couple of issues introduced in 2015.0.25
Fixed editing issue in endogenous capacity screen. Screen went blank after editing an expression.
Fixed display issue: when navigating to TED and back to Analysis view, expressions would appear as zeros.
Creating a user-defined effect in an area with optimization-based scenarios would cause an error in LEAP's calculations.
Updated optimization calculations to allow for inclusion of effects that are measured in volume and area units (in addition to mass units allowed previously).
Fixed problem with assigning effect categories when adding a new effect.
2015.0.25: 9/2/2016
Calculation Speed: Calculation times for LEAP areas that make heavy use of user-defined variables (such as the new LEAP-IBC models) are reduced by 80% or more. Other areas also now calculate about 20-40% faster than v24. In one LEAP-IBC test model, calculation time was reduced from 180 seconds to 31 seconds (roughly six-times faster).
Fixed problem that prevented adding new key parameter "levers" in the Overviews screen.
Fixed display problems on batch importing from Excel (problem introduced in v24).
Fixed problems with incorrectly set pollution effects when using "Insert Branches from Folder".
Fixed issue with integrated debugging. After reporting an error in a scenario, the user was returned back to the Analysis View screen, but it was not properly displaying the scenario with the error.
Further improvements to user variables to support default expressions more robustly.
Fixed error while drawing Sankey diagrams when selecting a large-scale energy unit like "Quads" that yields very small values for energy flows.
Minor changes to the Manage Tags and User Variable Properties screens to improve usability.
Other minor bug fixes.
2015.0.24: 8/25/2016
New Auto recover Capability: If your computer or LEAP crashes, and an Area has not been saved, then next time you run LEAP it will offer to attempt to recover your data. The data will be written to a brand new area called "Area (Recovered DD-MM-YYY)" using the working area name and current date.
Long Expressions: Now supports expressions up to 30,000 characters, compared to approximately 1,500 characters in past versions. Note however, that a so far unresolved display glitch prevents expressions longer than about 5200 characters in length from fully displaying in the Analysis View data table. However, they can still be edited via the Expression Builder.
Responsive Editing: Eliminated time lag when editing/entering an expression in the Analysis View data table.
Improved aliasing within expressions: You can now create aliases for branches as well as branch/variable combinations. This makes aliases more useful for shortening and working with expressions. Note also that the Alias screen has been renamed from "Variable Aliases" to simply "Aliases" and is accessed from the Analysis menu in the Analysis view.
Fixed drawing issues with Sankey Diagram: including (a) errors due to the list of primary resources visible in the tree not being fully refreshed, and (b) incorrect ordering of Sankey nodes in cases where demand sectors and subsectors or Transformation processes have the same names as fuels.
Improved Code Completion: Improved the expression code completion capabilities to work with the new aliasing feature and to give more information about variables, branches and units in the code completion popup windows. As a reminder, when writing an expression, LEAP will show a popup to help you complete the branch, variable and unit in a variable reference when you press the "\", ":" and "[" keys.
Improved Check-As-You-Type: Also improved the operation of the check-as-you type feature to make it less obtrusive when editing an expression and to give better diagnostic messages. It will now only activate after a one second delay after a key was last typed. Any key press resets this one second delay.
Fixed and improved file drag-and-drop function: This lets you drag a ".leap" file (e.g. from Windows Explorer) and drop it into the main LEAP screen, to install them as new LEAP areas. This functionality had been broken in recent LEAP versions. LEAP now also supports dropping of multiple files onto the main LEAP screen, and will then ask you to confirm that you want to install each dropped area.
Fixed error when attempting to write an indicator variable during a calculation in cases where you are trying to access the energy balance, overview, or summary views.
Fixed error when calculating just one (of multiple) optimization scenarios.
Revisions/reorganizations to popup menus in the Analysis view to make them more consistent and usable.
Various additional bug fixes and refactoring for improved operation.
Updated help.
2015.0.23: 8/7/2016
Two files required for LEAP registration were missing from main setup program, causing error message "Cannot Load SSL Library". Download and rerun full LEAP setup program if you have experienced this issue.
2015.0.22: 8/3/2016
Updates to data in IBC module (no effect on regular LEAP calculations).
2015.0.21: 7/28/2016
Updates registration features to work with new secure LEAP web site.
2015.0.20: 7/19/2016
Fixes bug where LEAP sometimes thought it was not connected to the Internet, even if it was (particularly in Windows 10). This caused various Internet-related options to appear disabled.
Updated LEAP Help Files: Reformatted for easier reading. The web-based version of Help is now responsive, supporting screens of any size: phones, tablets and PCs.
Updated LEAP and LEAP installation programs to use new and more secure 256 bit digital signatures. The older "sha1" digital signatures are no longer supported by Windows 10 and can cause Windows to report that the "signature of setup.exe is corrupt or invalid".
Fixed problem that prevented scenarios from being selected in the Results View legend if a chart was shown in a comparison format (avoided, differences, wedge charts).
Fixes to LEAP API to properly support expressions written in non-English number formatting.
Cosmetic Changes to LEAP logo (to match new LEAP web site, which will be launching shortly).
Internal changes and code reorganization to better support the new Integrated Benefits Calculator (IBC) module. This module will be made fully publicly available in late 2016.
2015.0.19: 4/14/2016
Fixed issue with indicators not being updated correctly in the (beta) benefits calculator tool.
Added new properties to the Area API to support communication of the country names and codes chosen in the Basic Parameters screen. This capability is used in the benefits calculator script so that the country code is now set within LEAP, rather than requiring the user to edit a VBS script.
Improved scenario selection behavior. Now preserves selection in Analysis view as you switch between Analysis and Results Views. Also remembers selections between sessions of using LEAP.
Improved layout of mini-views toolbar (now at top of tree). Fix to bug affecting tree sizing.
2015.0.17: 4/12/2016
Bug fix: Some data excluded from time-series wizard when opening an existing expression.
Updated Benefits calculator (beta).
Bug fix: Branches.exists API function not working when LEAP was calculating.
2015.0.16: 2/9/2016
Redesigned User-Variable properties screen to use less on-screen vertical space and improve usability.
Added button in Analysis View toolbar to make viewing/editing variable properties easier.
Fixed crash when adding a new unit.
Fixed bug: unable to properly select a demand fuel branch or edit associated fuel in fuel economy variable (in Transport stock turnover branches).
Fixed: Incorrect label sometimes displayed for denominator unit in useful energy intensity variables.
Added new partial/complete versions to Transport, GHG Mitigation and Optimization Exercises. Use the Area: Revert to Version menu option to select the "pre-cooked" versions.
Revised help files.
Updated Training Exercises with numerous minor fixes and updates and more consistent formatting.
2015.0.14: 12/28/2015
Fixed Problem in Results View: Some results (e.g. import and export costs) would not be displayed when working with areas originally created in older versions of LEAP.
2015.0.13: 12/18/2015
Fixed error in General: Scenarios screen when adding a new scenario as the first child scenario of an existing scenario.
2015.0.12: 12/13/2015
Major Revision to Environmental Effects: Now includes 258 standard effects (up from 123 in last version) including all of the new chemicals included in the most recent (5th) IPCC Assessment Report (AR) including halogenated alcohols, ethers, hydrofluorocarbons, chlorocarbons, hydrochlorocarbons, bromocarbons, hydrobromocarbons and halons. For 5th AR chemicals, this includes 20 and 100-year Global Warming Potential (GWP) values plus values for Absolute Global Warming Potential (AGWP), Global Temperature Potential (GTP), Absolute Global Temperature Potential (AGTP), Radiative Efficiency and the chemicals' lifetimes. LEAP now lets you specify alternative IPCC AR GWP values for different scenarios: thus enabling sensitivity analyses that show how different IPCC AR GWP values affect the overall global warming potential (GWP) of your analyses. A new option in the Scenario Manager screen lets you select which IPCC AR to use for each scenario. These values inherit across scenarios unless overridden. Thus, if you select IPCC AR2 values for Current Accounts, then AR2 values will be used for all scenarios unless you override this setting for a particular scenario. Note that for national climate mitigation reporting purposes it is currently still recommended to use AR2 or AR4 values.
Note: if you have previously included custom effects in your LEAP data sets, these will be automatically migrated to the new longer set of effects used in the new version of LEAP.Improved Effects Screen: The Effects screen has been improved to allow you to more easily switch among GWP values for the five different IPCC assessment reports (ARs). An "edited" indicator in the Effects screen toolbar will also alert you if any of the IPCC values have been manually edited. For the fifth assessment report (AR5) you can either choose GWP values excluding climate carbon feedback (recommended) or values that do include feedbacks. Also, when showing AR5 values only, the Effects screen will display values for additional metrics of global warming including GTP, AGTP, AGWP, Radiative Efficiency and the Lifetime of each GHG in years or days. These metrics are not displayed in LEAP when selecting earlier IPCC Assessment Reports (1..4). Note that 500-year integrated GWP values are no longer reported in the fifth IPCC Assessment Report. Note also that GTP, AGTP, and AGWP values are currently for information purposes only. They are not yet utilized in LEAP's overall emissions calculations.
The Show selection box on the Effects screen now lets you flexibly select different subsets of effects to show. You can show all effects, all effects currently being used in your area, all effects with non-zero GWP values, or any one category of effect. The effects screen also now supports exporting of all metrics to Excel. Finally, the effects screen now has better support for sorting effects by name, order, abbreviation, category, and various metrics such as 20 and 50 year GWP values.Further Improvements to Tags: Tags have been added into the LEAP Application Programming Interface (API): Tag information can now be accessed using the LEAP.Tags API collection. This gives access to the name, ID, order, description and group name of tags.
New InterpYearlyShape function: Used to calculate yearly shapes by interpolating among different named shapes specified in the General: Yearly Shapes screen for up to 10 different years and shapes. This is similar to the YearlyShape function but more flexible, since it allows you to specify shapes for any particular year. Allows up to 10 yearly shapes to be specified.
Revisions to Units: Various improvements to improve the precision and accuracy of some units and to fix problems with a few fuel economy units. In addition, unit names and abbreviations have been updated to better reflect standard naming conventions. For example, kWh, MWh, GWh and TWh replaces kW-hr, MW-hr, etc. For most users, these changes will only affect results if doing transport stock turnover modeling. The General: Units screen has also been improved: A new indicator shows if a fuel economy unit is an "inverse" unit. Fixed display of unit class when showing all units. Fixed error when sorting units by clicking on column headings.
Behind-the-scenes integration with our new bug-tracking and management system: Crash reports are now automatically logged in our new bug tracking system, which should lead to better overall software quality in the future.
Fixed Bug in Transport Stock Turnover energy calculations: LEAP was incorrectly calculating values in situations where fuel economy was specified in an inverse unit (e.g. MPG or km/Liter) and a non-constant fuel economy lifecycle profile had been specified. If either of the situations were not true (i.e. if fuel economy is assumed to have no degradation as vehicles age, or if fuel economy was specified in Liters/Km or some other non-inverse unit) then results are unaffected.
Fixed problem showing "difference" reports for Transformation environmental effect results.
Fixed problem in Results View. Externality costs were not being displayed in Social costs reports.
The constants BY, EY, LHY and FSY were sometimes causing problems in expression parsing. These have now been removed. Please use the longer terms "BaseYear", "EndYear, "FirstScenarioYear" and "LastHistoricalYear" instead. Any existing use of these shorthand terms will be automatically updated to the longer terms when you update to the newer version of LEAP.
More reliable code for detecting if the computer running LEAP is online or offline. Options requiring a live Internet connection such as opening areas from the Internet, emailing data sets or accessing the LEAP web site will now be grayed out if a live Internet connection cannot be found.
Fixed various broken help buttons, which were not functioning or not linking to the correct page in the help file.
Help Files updated and improved to reflect changes.
2015.0.11: 11/24/2015
Improved Tree Editing: When refreshing the tree (e.g. when switching views or adding/deleting tree branches), LEAP now preserves which branches are expanded/collapsed.
Bug fix: Editing properties of a category branch would cause lower level branches to be deleted if they were using a stock turnover methodology.
Bug fix: Fixed tree refresh problems when tagging branches.
2015.0.10: 11/22/2015
-
Using Tags to set the Scope of User Variables: You can now add tags to limit the visibility of user variables to only those branches containing one or more of the listed tags. If no tags are set for a user variable, it will be visible at any branch (whether it is tagged or not).
Using Tags to Color Code the Tree: In the Analysis, Results and Notes views, you can now get an overview of which branches have been marked with which tags. Right-click on the tree, or select the tag toolbar at the foot of the tree and select option "Color Branches with Tag Group...", then select one of the tag groups. The tree will be recolored based on the colors of tags in that particular tag group. If you don't want to color code the tree, select "None".
-
Reduced Time to Calculate Direct Plus Indirect GHG Emissions: Indirect emissions calculations are now much faster. Also, results are now associated with feedstock fuels rather than with demand fuels.
Improved Exporting to PowerPoint: If LEAP is exporting a chart to an already open PowerPoint window, it no longer repositions the PowerPoint application window. In addition, the exporting process now does a better job of sizing and positioning the chart and the slide title text.
Fixes to various issues affecting display of results when using load shapes specified at demand devices. Also fixed issue where merit order could not be selected as a method when using this load shape method. Improved error checking in demand-side load shape calculations.
Fix in Results view affecting axis labels when displaying an "avoided" result with time slices on the X axis.
Fixed occasional error in Results view when using Grouping option.
Fixed error introduced in last version when clicking on "All Variables" tab in Analysis view.
Improved and reorganized help for costing variables and fixed problems when selecting dimensions of costing result variables. Fixed issue in which tree selection did not change when selecting cost variables specific to Transformation modules.
2015.0.8: 11/11/2015
Direct plus Indirect GHG emissions: LEAP now calculates and displays GHG emissions results in different ways: Direct vs. Indirect. Direct GHG emissions show GHG emissions at the point where the emission occurs (typically where a fuel is combusted). This result type corresponds to the approach used in previous versions of LEAP, and these emissions can be displayed using either 20, 100 or 500-year global warming potential (GWP) factors. GWP factors enable emissions of CO2, CH4 and N2O to be combined into CO2-equivalent (CO2e) values. Direct emissions can occur at Demand, Transformation and Non-energy sector branches.
This new version of LEAP can also display Direct plus Indirect GHG emissions allocated back to the demand branches that were ultimately responsible for those emissions. This type of emission result includes the Direct emissions occurring at any particular demand branch plus the indirect Transformation emissions that arise from any given demand. This type of result does not include any non-energy sector emissions.Improved Tag Management: The Tags screen (shortcut: Alt+T) has been moved to the General menu and has been improved to allow grouping of tags. For example, you can now make groups related to policies, sectors, technology types, etc. The user interface for specifying tags has also been revamped and simplified. When filtering by tags, it now shows the tag colors and also clearly indicates if a filter is based on the presence of any (a or b or c) or all (a and b and c) tags. In addition, when adding or removing tags from branches you will now be given the option to add or remove a tag at all branches below the current highlighted branch: thus making it easier to apply tags across many branches in the tree structure.
Tagging of Key Parameters in the Scenario Explorer: Tags can now also be used to filter key parameters in the Scenario Explorer (part of the Overviews screen). This helps to manage large numbers of key parameters: more than can easily be shown on screen at any one time. The "Edit Key Parameters" dialog (accessed by right-clicking on a key parameter) has been updated to allow you to associate tags with key parameters. You can also now hide the "Additional Scenarios" panel in the Scenario manager to free up more space if you are not using that feature. Hover-over hints have been improved to show the tags associated with each key parameter.
Tags in Expressions: Three new expression functions have been added to help calculate values based on whether a branch has particular tags:
- AnyBranchTags(Taglist) returns true if the branch is tagged with any of the tags included as parameters to the function.
- AllBranchTags(Taglist) returns true if the branch is tagged with all of the tags included as parameters to the function.
- NumBranchTags returns the number of tags at a given branch.
The LEAP Functions wizard has also been updated to support selection of tags in the AnyBranchTags and AllBranchTags functions.Bug Fixes for Tags: When showing results filtered by tags LEAP has been made more robust to work properly across all branch types.
Improved Results View: Entirely blank rows of data are no longer displayed in charts and tables: thus making makes them easier to read. The exception to this is when showing results using the "Differences" option, in which case all rows are still displayed (to make it easy to confirm where there are no differences).
Improved Exporting to Excel: If LEAP is exporting to an already open Excel window, it will no longer (annoyingly) reposition the Excel window.
Minor improvements when editing expressions in the main Analysis View table (better handling of left and right arrow keys).
Simplified the main toolbar to hide the New, Backup and Email buttons except when in Analysis view.
Bug Fix: Now properly calculates expressions referencing the "Total Activity" variable.
Bug Fix: References to variables that themselves referenced results were not calculating correctly.
Bug Fix: Fixed error when displaying results using the "Avoided" option. If the chart X axis was anything other than years, this type of result was not displaying correctly.
Bug Fix: Fixed error when first showing a map in Results View.
Bug Fix: Fixed error that caused indicator expressions to be calculated, even if indicator branches were hidden in the General: Basic Parameters screen.
Bug Fix: Fixed splash screen position on multi monitor PCs.
Bug Fix: Some expressions referencing other branches and variables could cause a stack overflow crash.
Bug Fix: LEAP was unable to show some types of environmental results giving the error message: <Cannot filter result of type "pollutant loading" on dimension "effects">. This was a bug introduced in 2015.0.7.
Bug Fix: Using the delete key to clear and reset an expression was not working.
Bug Fix: Fixed crash in General: Lifecycle Profiles: Export All feature.
Updated help files reflecting above changes and new functions.
2015.0.7: 10/10/2015
Improved synchronization of non-energy effect branch names after editing the General: Effects screen.
Fixed issue in General: Effects screen in which effect names were not being properly validated after being edited.
Fixed issue in General: Fuels screen where the fuel name column became read-only after a name was edited.
Improved user interface for adding non-energy sector effect branches.
Fixed occasional range error when opening Diagram View. Note: The Diagram View is deprecated and will be removed soon. Please use the new Sankey Diagram instead.
Improvements to some error messages.
2015.0.6: 10/2/2015
Fixed issue where regions could not be placed in chart legend in Results view.
Fixed problem with showing GWPs and some other types of results in multi-region data sets.
Fixed issue where externality costs were not showing in Results view.
Fixed issue in Results view when exporting charts where exported chart subtitle was not being updated to match the one displayed in results view.
Fixed issue in which "Check as You Type" feature failed to correctly handle constants such as "BaseYear", reporting an unrecognized character "@".
Fixed issue preventing display of imports/exports and import/export costs in Results view in single region areas.
Fixed issue affecting time slices and import of load shapes when date format contained non-english (unicode) characters. The start and end date of time slices was not being generated correctly which in turn prevented hourly load shapes from being properly imported.
Fixed issue in which expressions referencing the future values of other complex expressions could not be calculated.
Fixed default GWP values from the IPCC second assessment report for HFC143a and specified a separate HFC143 gas in default and Freedonia data sets. In other data sets you will need to fix these values manually, by editing them in the General Effects screen.
Fixed calculations for auxiliary fuels, when they are set to be produced from the same process where they are consumed.
Restored ability to edit effects when editing the Non-Energy Effect Loading variable.
Fixed issue where bar charts sometimes had a non-zero minimum on Y axis.
Improved error message for HistoricalGrowth function.
Fixed error in Find (F3) dialog.
2015.0.4: 9/15/2015
Bug fix: Fixed error when parsing complex time series expressions that included references back to earlier years of the same variable (e.g. by using the Value function). After recent changes to LEAP, these expressions were producing "circular reference" errors, but are now working correctly.
2015.0.3: 9/4/2015
Sankey Diagram: now works correctly on PCs with non-US/British number formatting.
Transformation Output Results Improved: can now show all products or primary products separately from co-products.
Restored ability to edit effects after they are initially chosen in the Analysis View: Effect Loading screen.
-
Further fixes to expression parsing: some complex expressions were not being properly interpreted after changes in v2015.0.
Apologies for so many recent updates!
2015.0.2: 9/2/2015
Faster Generation of Results View Charts and Tables: Time to generate charts reduced by 50-75% versus v2015.0.1.
Faster Calculations: Calculation time reduced by about 10% vs. v2015.0.1
Primary Energy Demands: Improved algorithm for calculating energy demand expressed in terms of the primary energy needed to meet each final demand. Now better able to consider imports and exports that occur in the area.
New Investment Cost Results Variable: Shows total non-annualized investment costs in each year for Transformation processes. In any given year, this result is the product of the unit capital cost and the capacity added. The results can be divided into domestic costs vs. foreign exchange and also subdivided into capacity additions specified exogenously or endogenously.
Improved Referencing of Results in Expressions: Now, rather than simply disallowing expressions that reference result variables in the same year, LEAP instead tracks which result variables are referenced in each year and only reports an error if a result is written after it has been referenced. In this way you can now (for example) write an equation in your Transformation or non-energy sector analyses that references same year results calculated in your demand analysis. Some restrictions still remain due to the order of LEAP's calculations. For example: expressions in your demand analysis cannot refer to the total final energy demand in the same year or to Transformation or whole area emissions results for the same year. Additional restrictions are imposed in scenarios that use optimization since these scenarios calculate results simultaneously across all years.
Better Handling of Constants: Renaming a constant will now also rename the occurrence of the constant in any expressions where the constant is used (just as already happens for the names of branches, fuels, variables, etc.). This change entails a one-time file format change, which means that a data set opened in v2015.0.2 cannot later be opened in V2015.0.1 or earlier.
Fixed issues related to parsing of expressions.
Fixed issue where line breaks and spacing were removed when submitting a formatted expression from the Expression Builder.
Fixed occasional error messages on shutting down LEAP.
Fixed occasional range error messages.
Fixed issue where results view attempted to show results for a non-calculating scenario or region.
Removed unnecessary message about corrupted scenario ordering in the Scenario Manager.
Fixed issue when displaying discounted costs in Results view (results were not in fact being discounted).
2015.0.1: 8/18/2015
-
Fixed Forecast function (LinForecast, ExpForecast, etc.)
-
Added warning message if Transformation module name is also a fuel name (which can interfere with drawing of Sankey diagrams).
-
Minimum required Internet Explorer version is now 10.0 due to problems drawing Sankey Diagrams with IE9.
-
Added checking/fixing of scenario ordering in Scenario Manager.
-
New option in Basic Parameters to allow a region to have non zero in-area import and export fractions.
-
Minor bug fixes in Results View.
2015: 8/14/2015
-
New Interactive Sankey Diagrams: Available from the Energy Balance View, these give an overview of energy flows through a LEAP area from resources through transformation to demands and includes a representation of such details as imports, exports, stock changes, statistical differences and losses. The Sankey Diagram has a number of configuration options including whether to display flows for each fuel or for categories of fuels. You can also set the level of demand detail: fuels only, fuels & sectors or fuels, sectors and subsectors. You can display a Sankey Diagram for any year of any scenario. In multi-region areas you can show the Sankey for the whole area or for any particular region.
Apart from showing a diagram for a whole area, you can also use the Zoom button to see the flows in any particular Transformation module such as Electric Generation or Oil Refining. In the Zoomed view, the diagram shows inputs and outputs to and from each process as well as any feedstock and auxiliary fuel use, coproduction of energy and losses.
The Sankey Diagram's nodes and links are laid out automatically, but you can also fine tune the layout by dragging and dropping any node to perfect the look of the diagram before printing or exporting it to a JPG file or a PowerPoint slide.
You can also select the Diagram's colors, set its energy units and adjust the padding of the nodes. The Sankey Diagram replaces the old Diagram view (which cannot show energy flows). The Diagram View remains for now, but will be removed in an upcoming release. Use of Sankey Diagram's requires Internet Explorer version 9 or higher.
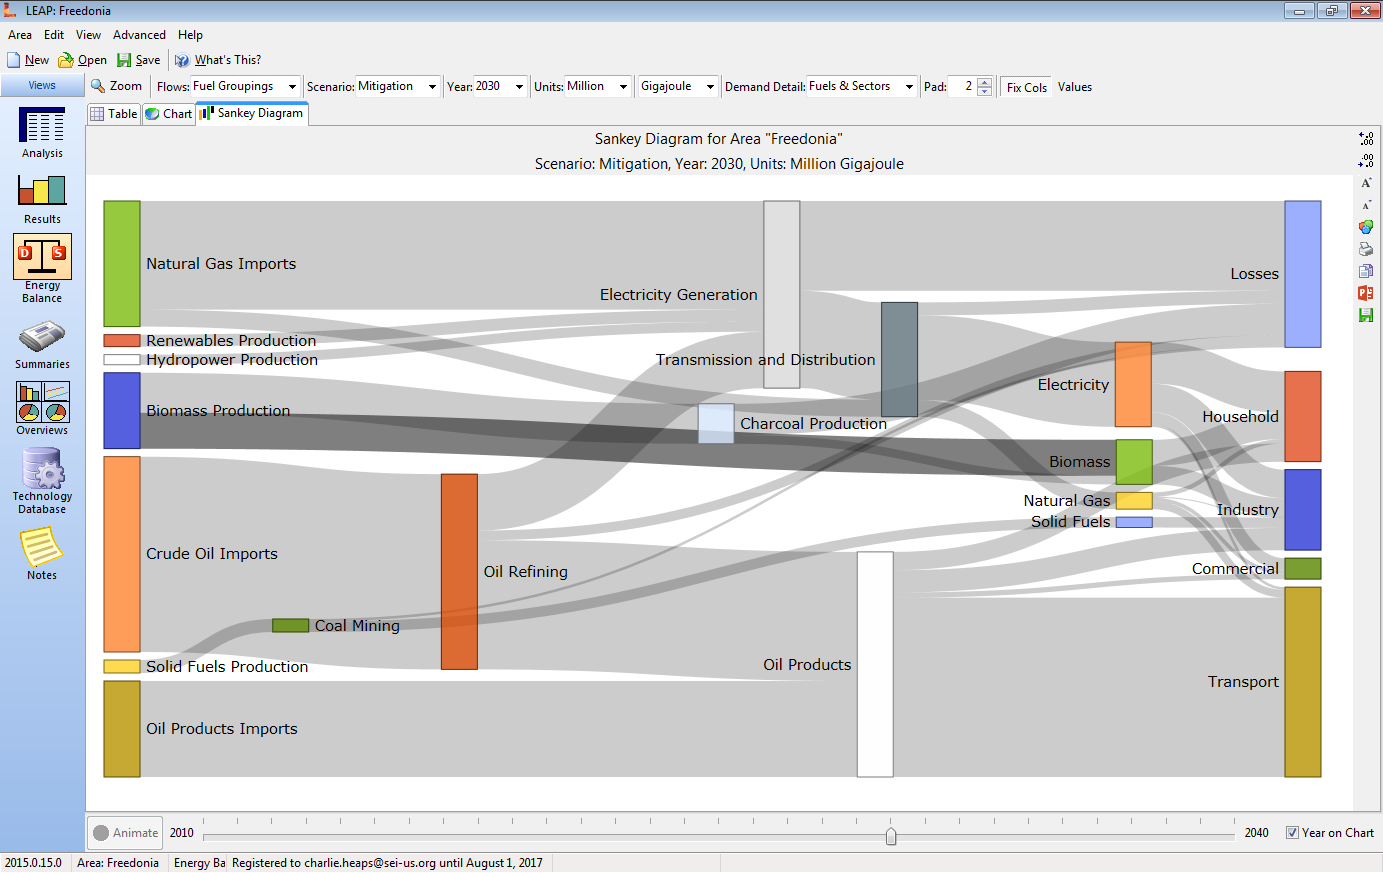
-
Easier-to-Use Results View: The Results View has been redesigned to make it easier to select results and harder to NOT select results. Simplified buttons eliminate visual clutter and reduce the number of times results need to be refreshed, making operations faster, especially for large data sets. In addition, LEAP now assists you when your selections lead to no results - a common source of confusion for users. A dialog now appears in these situations alerting you to any results dimensions where you have specified only selected elements and offers to try again - "relaxing" your selection by choosing all elements for that dimension.
-
New Autorefresh Capability in Results view: For larger data set you can switch off AutoRefresh and then make changes to multiple settings before manually refreshing the results by pressing F9 or clicking the Refresh button in the main toolbar.
-
Analysis View now automatically resizes table/chart splitter to fit the table and maximize size of chart.
-
Faster Calculations: Calculation times for large data sets that make extensive use of "Interp" and other time-series functions reduced by about 15%.
-
Improved Operation of LEAP with CPLEX solver: CPLEX uses XML to store its results. Reading these results for large models was taking a very long time and could also result in out of memory errors. Using an alternative coding approach, the time taken and memory requirements have been reduced to almost nothing.
-
Improved User Variables Properties screen: Now works correctly on PCs with non standard screen font sizes.
-
Improvements to Expression parsing to better detect circular branch/variable references and reduce chance of stack overflow errors.
-
Fixed parsing of logical "AND", "OR" and "NOT" operators in expressions and introduced a new operator "XOR". Also, updated help files and improved expression builder to give help on use of operators as well as functions.
-
Improved handling of Notes: Editing of notes no longer causes the area to be recalculated.
-
Branches named for fuels or effects now automatically synchronized with the fuels and effects database: The names of these branches can no longer be edited by the user.
-
Checks added during calculations to ensure that there are no duplicate effects in immediately neighboring tree branches.
-
Improved handling of errors in expressions so that display is properly refreshed after fixing an error in one branch affecting a neighboring branch.
-
Fixed errors in handling of ConvertFuelUnits function in cases where the fuel name was the same as a neighboring branch name.
-
Rearranged main toolbar to hide items that are not relevant in certain views: thereby making screen less cluttered.
-
Added new setting in Basic Parameters so you can optionally save the area after each scenario is calculated. Only recommended for very large data sets (causes slower calculations).
-
Fixed issue where LEAP was not displaying co-product results.
-
Fixed issue where LEAP was still listing result variables for display in Results View even if they were marked to not be calculated.
-
Fixed issue in which LEAP always displayed GHG emissions, even after these were switched off in the General: Results to Save screen.
-
Simplified types of results in General: Results to Save screen: merges energy and non-energy sector effects into a single list.
-
Faster navigation between main screen and supporting screen (fuels, scenarios, regions, effects, units). Now if you haven't changed any values when visiting one of these screens they close instantly. Also, the Scenario Manager screens is more responsive when editing large areas.
-
New one-time screen within LEAP to display and ask users to accept the LEAP Terms and Conditions. Terms and conditions revised to include information on privacy and data collection.
-
Fixed problem when trying to register LEAP using your COMMEND web site password.
-
Minor fixes to Analysis: Import feature.
-
Fixed issue where error handler was not fully reporting the source code line numbers of errors.
-
Fixed range check errors during calculation of some data sets.
-
Tested to run OK on Windows 10 (also supports Windows XP, Vista, 7, 8 and 8.1). We no longer support Windows 2000 or earlier. Please also note that Windows XP is no longer supported or maintained by Microsoft so is not recommended for use with LEAP.
-
Updated help files.
LEAP 2014
2014.1.29: 6/7/2015
- Fixed bug that caused a "Circular Reference" error when using the Value function for lagged references to previous year's values.
Fixed bug in some data sets, where you had to click Results View twice to see any charts or tables after making an edit.
2014.1.28: 6/3/2015
Major reorganization of calculations to fix issues related to energy imports and energy exports in multi-regional models using optimization. LEAP now has tighter rules on inter-area energy trade. If one region exports energy to other regions in the same area, then that region may no longer also import that same fuel from within the same area. If the region is unable to meet its combined domestic and export requirements, the fuel must come from imports from outside the area. This change was needed to stop potential run-away iterative calculations of multi-regional models. LEAP also does better checking of the calculation convergence criteria in the Basic Parameters: Calculations screen, to ensure that the convergence values are correctly scaled to the size of the area being calculated.
Improved Import from Excel/Export to Excel options in the Analysis menu. Exporting now creates an improved layout spreadsheet template and lets you control how many individual levels of branch names are exported for sorting and filtering. Importing is now more robust, and provides better error messages in cases where importing fails. LEAP supports importing from both the new format spreadsheet template and the older format template. By default, importing now does a better job of using expression inheritance so as not to create redundant entries in expressions duplicated across multiple scenarios and regions.
-
Incorporated SEI's benefit calculator tool into LEAP distribution in preparation for forthcoming impacts-benefits calculator tool. (Stay tuned!)
Improved updating of older areas to better detect reserved words in branch names and improved renaming of those branches to make them legal using underline characters. Also added new menu option under the Area: Check: Check and Update Names to allow you to check all branch names at any time.
Improved handling of errors in scripts run during LEAP calculations. LEAP now looks for the presence of a text file "script.err" after finishing each script. If such a file exists, the calculation is halted and the contents of the script.err file is reported back in LEAP's error handler.
Application Programming Interface (API) expanded to include an Exists property for branches, scenarios, regions, fuels and effects collections. Use to test if a named item exists. Returns true or false. e.g. Fuels.Exists("hydrogen") returns true if the current area has a fuel named hydrogen. Also fixed various API bugs.
Improved Analysis View to better display multi-regional information when viewing "All Regions". Fixed branch selection box in Analysis View to properly select only one branch when showing multiple scenarios or regions.
Updated icons to match those in Microsoft Office 2013 (Excel, Word and PowerPoint). LEAP does of course also support Office 2010 and Office 2007. Only the icons are updated!
Improved diagnostics in Results View. By default this now only displays warning messages but you can also filter the display to show either warnings only or warnings and messages. Improved diagnostics grid layout and icons.
Fixed display of resource costs in Analysis View when default energy unit is not Gigajoules. Additional refactoring to make units conversion more reliable in calculations.
Fixed rare issue whereby setting a variable to "unlimited" was not actually setting a high enough value in some data sets. The "unlimited" function now returns a much higher value (1E40).
Fixed an error when calculating Transformation capital costs in a data set with only Current Accounts data and with multiple years of Current Accounts data.
Improved color palettes to make them more easily readable (red, green, blue and grayshade palettes). Chart legend now shown with gray background.
Added two new functions TimeSliceHours amd TimeSliceCumulativeHours for use in modeling seasonal and time-of-day variations in energy use.
Fixed a problem where references to results values in previous years might calculate zeros in some situations.
Improved display of calculation progress dialog box.
Fixes and user interface improvements in the Advanced: Events screen and in the handling of scripts.
Fixed potential crash when opening area by double-clicking a file in Windows Explorer
Fixed issue when exporting zero values to Excel from LEAP tables. These were incorrectly being formatted as percentage values.
Fixed issue where resource tree branches were sometimes incorrectly hidden in multi-region areas. This also affected calculation of resource production.
2014.1.25: 4/5/2015
-
Bug fix: Fixed problem in optimization calculations where capacity results were not being properly saved after some calculations.
-
Improved Symbols in Line Charts: Symbols now change with every chart series to make charts easier to read. Also removed black border on symbols and fixed problem with symbol/line colors in some chart configurations.
-
Improved Advanced Chart Options: Reinstated access to most advanced chart options (lost when LEAP was updated to Delphi XE7)
-
Improved Chart Labels: Smaller borders around labels to make charts easier to read.
-
Bug fix: Fixed display problems in script editor when it was set to stay on top of other windows.
-
Bug fix: Fixed problems in API caused by recent major update.
-
Bug fix: Area scale setting in Basic Parameters not being properly saved. Also added additional scale option: "undefined"
2014.1.24: 3/31/2015
-
Bug fix: Further fixes for expressions that reference result variables: most notably in areas with multi-year Current Accounts data and in Indicator variables.
-
Bug fixes: Fixed various problems when using LEAP with non-English number formatting (e.g. French, Spanish)
-
Bug fix: Not showing "percent" scaling factors in Analysis View grid after update to 2014.1.22.
-
Bug fix: In Analysis View: Demand branches, LEAP was incorrectly allowing a technology to be added next to a category.
-
Bug fix: In Analysis View: Demand Load Shape variable not editable for any demand branch when "Only show load shapes for electric technologies" enabled in Basic Parameters: Loads screen.
2014.1.23: 3/24/2015
-
Bug fix: Resolved "invalid expression" error when parsing some complex expressions: a problem introduced in the last version (2014.1.22).
-
Bug fix: Error in Analysis view if trying to reference a result variable in a scenario that is not marked to be calculated. Now returns zero.
2014.1.22: 3/21/2015
-
Resolved Problems Caused by Anti-Virus and Cloud-Synchronization Software: Reorganized folder structure of LEAP data files to address problems caused by cloud backup and synchronization software like Dropbox, OneDrive, Google Drive etc. and some anti-virus tools (such as ESET Antivirus). If these programs were set to synchronize or scan the "My Documents" folders (where the LEAP working folder resided) then a crash could occur when these tools temporarily locked data files needed by LEAP. To address this, the LEAP settings and working folders have been moved to the AppData location in Windows (normally "\Users\User Name\AppData\Roaming\SEI\LEAP" in Windows 7 or later). We believe this change will alleviate crashes being experienced by some LEAP users. The General: Basic Parameters: Folders screen has also been updated and simplified to match this change. You can still relocate the Area folder, but LEAP settings are now always located below the user's AppData folder. Note: if problems persist on your computer even after installing this update, please ensure that any antivirus and/or cloud backup software is set to NOT scan any of the folders used by LEAP including the settings folders and below.
-
Improved Time Slices and Yearly Shapes screens: including better setup of time slices, fixing the normalization of imported hourly load shapes, and performance enhancements to improve the speed of importing hourly load data. Also, improved performance for data sets with large numbers of time slices (e.g. 365 daily slices or 8760 hourly slices). Note however that we recommend NOT attempting to use LEAP with 8760 hourly time slices except for very small data sets, since the memory requirements of this are very large.
-
Reorganization of Transformation Calculations: now supports multi-regional calculations when combined with optimization. Also, revised and simplified the Advanced: Events screen to reflect these changes.
-
Better Copying/Moving of Branches: Where possible, references in functions to same, parent, grandparent and sibling branches are now stored as relative branch references, rather than as absolute references. When copying a group of branches that include complex functions or variable references, the equations will be preserved as relative branch references.
-
Non-Energy Sector Costs: Added new variable to allow costs to be associated with non-energy sector effect loadings. These costs are integrated into LEAP's overall cost-benefit calculations and displayed in the cost-benefit report in the Summaries view. Minor user interface improvements and fixes to Summaries view.
-
Improved Charts: including two new color palettes and improved behavior when hovering over chart data, which now highlights series in bold in the chart legend. Improved chart formatting in radar and 3D bar charts.
-
Improved User-Defined Variables: Now allows variables to be specified as read/write or read-only differently in Current Accounts vs. in scenarios.
-
Improved Sorting in the Fuels, Effects, Regions and Units screens: You can now sort most columns in either ascending or descending order by clicking on the appropriate column title. A new indicator is displayed in the column title to show which column is used to sort the table. The indicator shows the sort order using a triangle pointing up for ascending or down for descending sorts.
-
Updated Diagram View: improved quality of diagram drawing and printing using GDI+. Now also allows user to select shape of diagram elements (rectangle, ellipse, rounded rectangle, hexagon, none).
-
Improved Registration Process: no longer requires dashes to be entered in registration codes (dashes now optional).
-
Reduced Calculation Time for stock turnover calculations.
-
Improved Scaling Behavior in Results, Energy Balance and Summaries views. Scaling factors (none, thousands, millions, etc.) are now more "sticky", so as you navigate among different charts and tables you won't need to adjust scaling factors so often.
-
Indian Numbering System: Scaling of results in LEAP now supports the Indian numbering system as used in India, Pakistan, Sri Lanka, Bangladesh and Nepal. By default this is off, but from the General: Basic Parameters: Default Units screen you can now choose to use Indian scaling factors (Lakh=100 Thousand) and Crore (10 Million) either in addition to or instead of LEAP's standard international (short scale) factors: thousands (10^3), millions (10^6), billions (10^9), etc. The choice you make here will affect the scaling factors displayed in the Results, Energy Balance and Summaries views. Note: this choice does not yet affect scaling factors shown in Analysis View, which currently only support international (short scale) factors. LEAP does not support long scale factors in which every new term greater than a million is a million times larger than the previous term.
-
Improved Security: The LEAP.EXE executable file is now digitally signed in addition to the SETUP.EXE installation file. Signing confirms that the file has been authored by SEI and by inspecting the file properties you can be assured that the code has not been altered or corrupted since it was signed.
-
Improved Units Conversion Dialog in Analysis View: Now previews the converted value. Also fixed problems converting fuel economy values.
-
Improved display of percentage share and growth rate format tables in Results View. Values now shown with a "%" suffix.
-
Fixed errors when navigating branches in the tree via key press. Screen was not properly updating the variable tabs on the right, causing error messages.
-
Fixed problem resetting expressions. Sometimes expressions were not reset to the default inherited expression when entering a blank expression.
-
Improved drawing of historical data/scenarios divider and added this capability to Analysis View.
-
Fixed problems when selecting units in Analysis View charts. Also fixed missing units and scaling factors in Analysis View charts and tables for Transformation variables.
-
Fixed General: Scenarios screen problem affecting renaming of scenarios.
-
Fixed Transportation stock-turnover modeling affecting specification of costs per unit sale of device.
-
Fixed number formatting when exporting to Excel.
-
Fixed problem when referencing results variables in an expression in the Analysis View: zeros were being erroneously returned. Also fixed error message when using a filter in a reference to results (e.g. "fuel=electricity").
-
Fixed problem where chart X axis was sometimes reversed when switching to Results View after showing a sorted load duration curve in Analysis View. This could cause results to be shown with the end year on the left and the base year on the right.
-
Fixed crashes when entering the Energy Balance and Summaries views if previously viewed scenarios were disabled or erased.
-
Fixed issue where enabling non-energy branches did not also enable some results to be calculated at those branches. Now at least calculates GWP100 results for those branches. Go to the General: Result Variables to Save menu option to view and edit the detailed list of which results variables are saved.
-
Fixed bug affecting resource imports and exports whereby user-selected scale and units were ignored.
-
Improved error and diagnostic messages when editing expressions.
-
Updated help and other minor bug fixes.
-
FYI: LEAP has been migrated to compile with Delphi XE7 from an earlier version of Delphi used previously. While this doesn't add any new features per se, it will allow additional new features and improvements to be added in the future.
2014.1.20: 11/29/2014
-
Improved Interaction with CPLEX Solver: The CPLEX solver was not working well on large data sets. Reading the CPLEX XML results file was taking a very long time (causing LEAP to appear to freeze). This part of the code has now been completely rewritten so that reading the CPLEX results is now almost instantaneous and also uses less memory.
-
Improved Unit Converter: The unit converter can now be kept on screen, even while working on other parts of LEAP. The formatting of numbers and the operation of the swap button have also been improved. The converter also now remembers units and values between sessions, reducing the number of clicks required to do a quick unit conversion.
-
Improved Energy Balances: You can now export ALL energy balances across all years and all regions to Excel, in addition to exporting just a single energy balance. Each balance is exported to a separate named tab in an Excel workbook.
-
Improved Results View to better handle results that cannot be summed across neighboring branches (e.g. efficiency, availability of processes). When showing these reports where branches are NOT on the X axis or in the legend, an extra selection box is now shown that is used to select just one branch for display in the chart.
-
Improved Help:About Screen: Additional information has been added to the Help:About screen recording the anti-virus/anti-malware/firewall software running in Windows. This new information will assist in the future with debugging potential problems such as issues with database connectivity.
-
Better Intermediate File Cleaning: By default, LEAP now does more thorough cleanup of intermediate files created during optimization calculations. These files can be quite large, especially when using CPLEX. Cleaning-up these files makes area folders much smaller and also speeds-up the opening and closing of areas. If you want to retain these files (e.g. when doing detailed debugging of optimization) switch on the "Keep Intermediate Results" checkbox in the General: Basic Parameters: Optimization screen.
-
Improved Charts: Area and pie charts cannot reliably be shown if some values are negative, so any such charts are now always shown as bar charts.
-
Improved Function and Time-series Wizard (accessed by pressing Ctrl-F and Ctrl-T respectively in Analysis view): These are now better at detecting function names and better at matching opening/closing parentheses in functions. The formatting of numbers returned from the Time-series Wizard has also been improved.
-
Bug Fix: International number format was not working when importing from Excel.
-
Bug Fix: Results reports showing Fuel Economy values were incorrect due to a unit conversion error in the Results view.
-
Bug Fix: In non-Baseline scenarios with different load shapes the System Peak Load Shape was not plotting correctly. X-axis values were not plotting correctly.
-
Bug Fix: The function wizard was incorrectly reporting the required number of parameters for the AnnualizedCost function.
-
Bug Fix: After switching international number formatting in the Windows Control Panel, but NOT setting the language in LEAP, a foreign language was displayed in the Results view Result menu.
-
Bug Fix: Diagram View sometimes not properly redrawing.
-
Bug Fix: Display sometimes not refreshed correctly in the Fuels and Effects screens when switching between showing all/used items. Color and order fields in regions/fuels/effects screens are no longer selectable.
-
Bug Fix: In line charts, option to toggle display of symbols on lines was not working.
-
Fixes to Saved Versions of Freedonia Area: Removed erroneous emission factors attached to some Transformation processes in various saved versions of the Freedonia area.
-
Performance Improvement: Improved refreshing of screen after a new language selected.
-
Performance Improvement: The Set Visible Branches in Regions screen was very slow after switching regions or when closing.
-
Performance Improvement: Delete Tree branch: Improved speed of operation and added a wait cursor while deleting.
-
Tips: Updated and edited with new tips about using LEAP and new quotations about environment and the future.
-
SPECIAL NOTE: We understand that a small number of users are experiencing intermittent errors when running LEAP on certain PCs. The problems generally cause an error message about a "root table Nexus database error" or a "missing table". We have been in touch with the developers of the database system utilized by LEAP and they tell us that the most likely cause is an overly aggressive anti-virus or anti-spyware tool, possibly when used on a slower PC. We have tested LEAP with different anti-virus/anti-malware tools but have not yet been able to identify particular tools that cause the problem. In this new version of LEAP we have added new data collection and reporting capabilities to the Help: About screen to try and narrow down the causes of these problems (see above). If you are experiencing this issue, please email leap@sei-us.org for additional assistance. Sorry for any inconvenience caused. Update: This issue has been fixed in LEAP v2014.0.1.21 and later (see above). Please update your version of LEAP if you are experiencing this issue.
2014.1.18: 10/15/2014
-
Adding/Moving Branches: In the recent release of LEAP (2014.1.16) where I made some changes to make the Analysis View more responsive, I inadvertently introduced some problems that caused error messages when adding or moving branches. This should be fixed now. Sorry for the problems!
-
Change in default behavior of HistoricalGrowth function. Based on feedback from users and colleagues, we have reverted back to the older behavior of NOT excluding outliers. Outliers can still be excluded with an optional parameter. Also fixed a bug in how this function is evaluated (introduced in 2014.1.16).
-
Improved Pasting Data from Excel: Improved error messages when trying to paste invalid data including checking of years and values. Now handles data with various currency symbols, thousand separators, percentages and zero values marked as "-". Fixed problem where LEAP sometimes ignored years when using "Paste Special" function a second time, and bug where first value in range is a zero. Better handling of blank cells in Excel.
-
Fixed bug: Cost Calculations not working for simple Transformation modules.
-
Fixed bug displaying Module Costs in Results view for some high level tree branches.
-
Improved self-registration procedures to enable automation in Windows. LEAP now shows a warning message on startup if not properly registered and attempts to register itself if running with administrative rights. Also, added better handling of situations where user does not have administrative rights in Windows, and improved guidance if registration fails.
-
Fixed problem with orphaned/phantom branches appearing as children of high level non-energy branch.
2014.1.17: 10/7/2014
-
Basic Parameters: Scope screen. Now allows you to enter meta information including a description of area, assign a scale to the area (national, subnational, multinational, global) and, if national, choose which country including "fictitious" for sample/training data sets. Also displays information (from COMMEND) about current user. This meta information will be used in the forthcoming ability to upload areas to COMMEND web site and search for areas based on their meta data. (Undocumented change from .16 version).
-
Improved Create Branches from Excel Wizard: Eliminated range errors, now faster, supports multi-region data sets (including hiding of branches only used in one region), also supports updating as well as creating branches from Excel. Better handling of blanks and bad data.
-
Improved responsiveness of interface, especially when exiting Basic Parameters.
-
Fixed error when switching for a second time to Results: Maps view.
-
Fixed error when calculating results immediately after adding effects.
-
Missing buttons on the right of the Environmental Loadings tab restored.
-
"Add Branch" dialog boxes now include help buttons.
-
Improved installation to eliminate error when running installation as a standard user. Note: you must have administrative rights to install LEAP.
-
Fixed range errors when calculating some areas.
-
Better checking/reporting if calculating with no valid demand data.
-
Improved checking for invalid branch names.
-
Improved drawing of RES diagrams. Shapes now outlined when color is white and better contrast colors for shape label.
-
Fixed energy balance reports to properly handle situations where results not calculated every year.
2014.1.16: 9/21/2014
-
Excel: Faster export of tables to Excel. Fixed an error when exporting to Excel 2013 if Excel not already running. Improved ability for LEAP to recognize if Office applications are installed. Known issue: some users reporting problems exporting to Office 2013 when installed via an Office 365 "Click to Run" subscription installation. We are working to investigate this.
-
HistoricalGrowth: New options in the HistoricalGrowth function. By default, this now excludes "outlier" values, defined in standard fashion as being any growth rate more than 1.5 interquartile ranges (IQRs) below the first quartile or above the third quartile in the set of all growth rates. New function syntax also lets you disable this default functionality.
-
Duplicate Names: LEAP no longer allows duplicate names in neighboring branches in the data tree. LEAP has been made stricter since duplicate names can cause ambiguities in handling expressions. The Add Branch dialog boxes have been improved to warn about and prevent this. Note: This was already the default behavior in older versions of LEAP, but could be overridden in Basic Parameters. The option to allow duplicates in Basic Parameters has now been removed and any old data sets with duplicates will now generate an error message when calculating, requiring you to edit names before proceeding to view results. The vast majority of existing users should be unaffected.
-
Improved Stock Turnover Modeling (1): New Variable "First Sales Year" lets you specify when stock turnover modeling begins. Before this year, you can simply specify total stock and LEAP will allocate this among vintages. This makes it easier to calibrate models and easier to use when you have multiple Current Accounts years.
-
Improved Stock Turnover Modeling (2): Added ability to model forced "scrappage" of devices, i.e. to exogenously specify the removal of devices in some future year (beyond those that would "naturally" be retired. Two new variables support this: "Scrappage", which specifies the total number of devices to be scrapped in a particular year, and "max scrappage fraction", which limits the fraction of devices scrapped in each vintage in a particular year.
-
Fixed bug in handling of Yearly Shapes: LEAP was not properly interpolating load shapes from the base year shape to the shape specified for the end year of a scenario.
-
Fixed Range Error during calculation of some multi-region data sets.
-
Made Scenario Explorer more robust in the Overviews View.
-
Fixed alignment problems in tables.
-
Analysis View data tables simplified for environmental effect branches: no longer shows both effects and branch names. Now just shows branch names to make behavior more consistent with other screens.
-
Fixed problems referring to results variables in Indicator branches and improved dialog boxes that assist with creating expressions referring to results values.
-
New versions of Freedonia data set to match latest updated training exercises.
-
Installation now includes new "TestLEAP" command-line utility: a simple tool for testing if a ".leap" data file is valid. Look for TestLEAP.exe in the LEAP program folder. Run the tool by passing the name of a ".leap" file like this "TestLEAP MyArea.leap". The utility will report back if the file is a valid .leap file, and if not what is wrong with it (missing files, includes disallowed executable files, not a valid archive, etc.)
-
Help updated to reflect above changes.
2014.1.14: 7/19/2014
-
Bug fix: variables were sometimes not being replaced by their aliases in expressions.
-
Added option in Analysis View popup to switch variable aliases on and off.
-
Fixed bugs affecting data entry and calculation of demand-side co-products.
-
Added two constants: "DiscountRate" returns the global discount rate, "InflationRate" returns the global inflation rate.
-
Made "DiscountRate" the default expression for the "InterestRate" variable in Transformation processes.
-
Better support for importing very old format (pre v2008) data sets.
-
Better support for old (.xls) format Excel spreadsheets and better handling of read-only Excel files and sheets that are already open in Excel before running LEAP.
2014.1.12: 7/17/2014
-
More robust handling of expressions that refer to branches/variables that have themselves been deleted or are otherwise invalid.
-
Fixed bugs causing error messages in the data entry table of the analysis view.
2014.1.11: 7/16/2014
-
Fixed issue introduced in v1.9: Expression builder not editable.
-
Edits/improvements to help.
2014.1.10: 7/15/2014
-
Fixes to charts in Results view. Charts showing, fuels and regions were not showing items in the proper order. Also, charts showing grouped fuels or grouped regions were not showing colors correctly.
2014.1.9: 7/11/2014
-
Fixed bug in optimized scenarios affecting results in Current Accounts years
-
First simulation year is no longer editable (but is still visible) in scenarios.
-
Digital signing of LEAP executable affected LEAP's error reporting system: so for now, only the LEAP installation program is signed, not the executable.
2014.1.8: 7/3/2014
-
Fixed bug in optimization calculations affecting fuel costs (introduced in v2014). While fuel costs were generally being calculated and displayed correctly in LEAP, they were being incorrectly passed to the optimization routines, thus causing incorrect optimizations. Fuel costs were being calculated per unit of energy produced, not per unit of energy consumed (i.e. ignoring process efficiency). This is now fixed.
-
Changed the calculation of discounted costs to make LEAP more consistent with OSeMOSYS. Capital costs continue to be discounted whole numbers of years, but discounting for fuel, variable and externality costs is now applied to the middle of the year in which these costs are incurred. For example if the discount rate is 10% then the discount factor for a capital cost in the first year will be (1/1+0.1)^1 = 0.909. For a fuel cost it will be (1/1+0.1)^0.5 = 0.953. This change will have a small impact on any discounted cost reports.
-
Added additional outputs into the intermediate optimization results files (opresults*.txt) to make debugging and troubleshooting of LEAP and OSeMOSYS calculations easier. The files now report total costs of each scenario as well as breakdowns showing capital costs, fixed costs, fuel and variable costs and externality costs.
-
Charts sometimes displaying incorrect X Axis label.
2014.1.7: 6/22/2014
-
Faster program startup.
-
Better error checking during calculations to ensure tree branch structure is valid.
-
Fixed bug in AnnualizedCost function when lifetime equals one year. Improved help for AnnualizedCost function to include levelization formula.
2014.1.6: 6/15/2014
-
Improved popup hints for long expressions in Analysis View.
-
Fixed range error when viewing results in data sets with costs enabled.
-
Fixed issue in accounting for auxiliary fuel use in energy balance when auxiliary energy is taken from the output of the process.
-
Fixed problem where results blanked out after pressing Save in Results views.
-
Ensured tag filter is cleared when opening another area.
-
Minor performance improvements in calculations and user interface.
2014.1.5: 6/10/2014
-
Expressions containing references to variables in other branches not working correctly.
-
Expressions containing PrevYearValue function caused crash.
-
Areas using the "Non Energy" fuel would not calculate properly. Calculations stopped with error message "Invalid fuel specified".
-
"Processes" branch not added when adding a new Transformation module.
-
Improved code for resetting process dispatch rules when Transformation module properties altered.
- Fixed issues when calculating primary energy demand allocated back to final demand branches.
2014.1.4: 6/7/2014
-
Last minute bug fixes affecting adding of branches and use of optimization.
2014.1.1: 6/6/2014
-
New Scenario Explorer: The Overviews view in LEAP has been updated to include a new Scenario Explorer which can be used in workshops to interactively explore how scenario results change as you alter key policy variables. Using this new tool, you can use slider bars that are directly connected to key parameters in your underlying LEAP data set to edit a scenario and immediately see the results in your saved Favorite charts. You can also use the Scenario Explorer to quickly switch on or switch off particular measures included in your overall policy scenarios and to directly create new scenarios from within the Overview screen. The Scenario Explorer combines with the New Full Screen View (accessed by pressing F11) to make LEAP much more useful in stakeholder workshop settings.
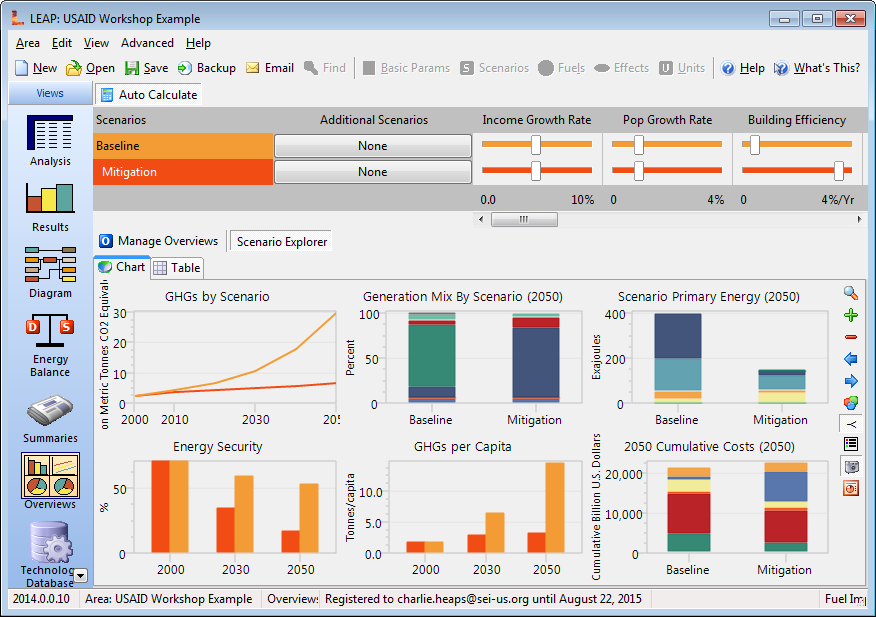
-
Speed: Calculations are now between two and ten-times faster versus an equivalent data set in version 2012 of LEAP. In addition, you can now choose to save only a subset of the calculated results using the new General: Results Variables to Save screen, making calculations faster still. The speed of the user interface has also been improved, making LEAP more responsive, especially when working with large data sets. Taken together these changes make LEAP much more useful for applications where stakeholders wish to explore scenarios interactively or for computationally intensive applications like Monte Carlo Analysis intended to explore the uncertainty in key variables.
-
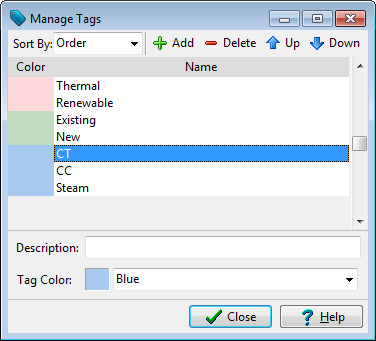 Tags: In addition to the traditional ways that data is organized in LEAP using its hierarchical tree data structure, you can now also use color-coded "tags" to help organize your data. This can be helpful for classifying technologies that belong to more than one category. For example, you might choose to tag your power plants according to whether they are thermal, renewable or nuclear technologies, or whether they are pre-existing or new types of power plants. You might also choose to tag them depending on whether they were specific to the area being studied or whether they were generic technologies. Each technology can have many tags, thus giving you lots of flexibility in how to categorize your data. The tag feature can be used to filter lists of technologies both in the Results View and in the Analysis view. The new Tag Manager screen (shown right) lets you organize and group all your tags.
 -
Improved Optimization: LEAP can now work seamlessly with IBM's "industrial strength" CPLEX solver for increased speed and the ability to handle larger data sets. By default, LEAP continues to use the included GLPK solver, but you can now also choose to use CPLEX, which must be purchased separately. You can even choose to solve some scenarios with GLPK and some with CPLEX to test the behavior of each solver.
- Improved Charting: Charting has been greatly improved to allow for the consistent color coding of fuels, effects, scenarios and regions across multiple charts. For example, when using this feature, if electricity is shown blue in one chart, it will be the same blue in all charts showing that fuel. The various supporting screens where you edit the list of fuels, effects, scenarios and regions, etc. have also been improved so that you can see the colors and patterns that will be assigned to each item, and to let you reorder items to set the color you prefer for each element. The use of shading patterns in charts has also been improved to charts more readable and new color palette called "patterns" has been added for use when printing charts in black and white. Other improvements include better drawing of chart axes, the use of the Windows GDI+ library for less jagged chart lines, the addition of tick marks on the Y axis and a new scroll bar in the chart legend to support the display of charts with many data series.
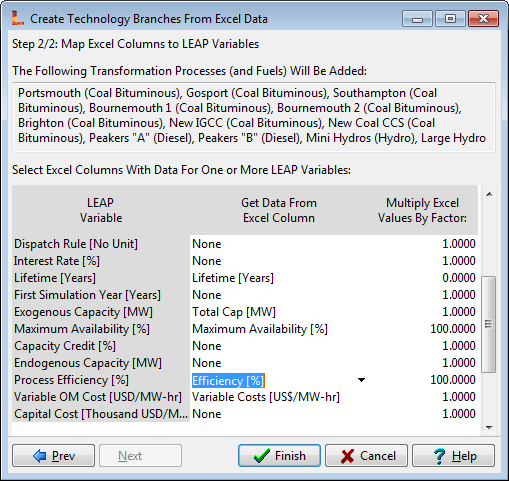 New "Create Branches from Excel" Wizard: Much of the data required for energy & climate planning is generally available in tabular form in spreadsheets. The new Create Branches from Excel wizard (shown right) provides a convenient automated way of creating a new set of branches in LEAP based on these tables, while also importing all of the data in the table into LEAP's Current Accounts data set. The wizard works by asking you to map the types of data in your spreadsheet table to the various variables expected by LEAP. Where possible it also helps by converting the data in the spreadsheet into the measurement units expected in LEAP.
- Improved Costing: Cost calculations have been improved in a number of ways. Firstly, we have improved the Transformation module cost balance report which shows the balance between revenue generated from sales of the output fuels produced from a module and the annualized costs of operating the module. Module costs include annualized capital costs, fixed and variable O&M costs, fuel costs and other module-level costs. The new version of this report now allows you to include the stranded costs (i.e. debt payments) on pre-existing capacity. It also allows feedstock and auxiliary fuel costs to be specified in a more flexible way, allowing them to differ from the overall resource costs specified for the whole area under the Resources branch, which are used in LEAP's overall social cost-benefit calculations. A new LoanPayment function has been added to let you easily calculate remaining annualized stranded costs based on the total cost and year when the loan for the original capacity was originally taken out.
-
Primary Energy Allocated Back to Demand Branches: An important feature from older versions of LEAP has been restored: the ability to show primary energy results allocated back to the energy demand branches that originally "caused" that energy use.
-
Better Linking to Excel: We have improved how LEAP links to Excel data sets, resulting in faster operation and more robust opening and closing of Excel and it's spreadsheets.
-
Improved Results Tables: Multi-level reports can now optionally be displayed with color-coded subtotals at each different level as shown below. This new format is in addition to the existing multi-level formats previously available. So for example, you can now see a single table showing total energy demand as well as subtotals and detailed results for each sector, sub-sector end-use. Zero values can optionally be hidden to make tables easier to interpret. Exporting tables to Excel has also been improved. Tables are now exported to Excel using the color-coding in LEAP and the full precision of results calculated in LEAP. LEAP then formats the values shown in Excel using the same number formatting selected in LEAP. Previously, results were only exported using the precision that was displayed in the LEAP table.
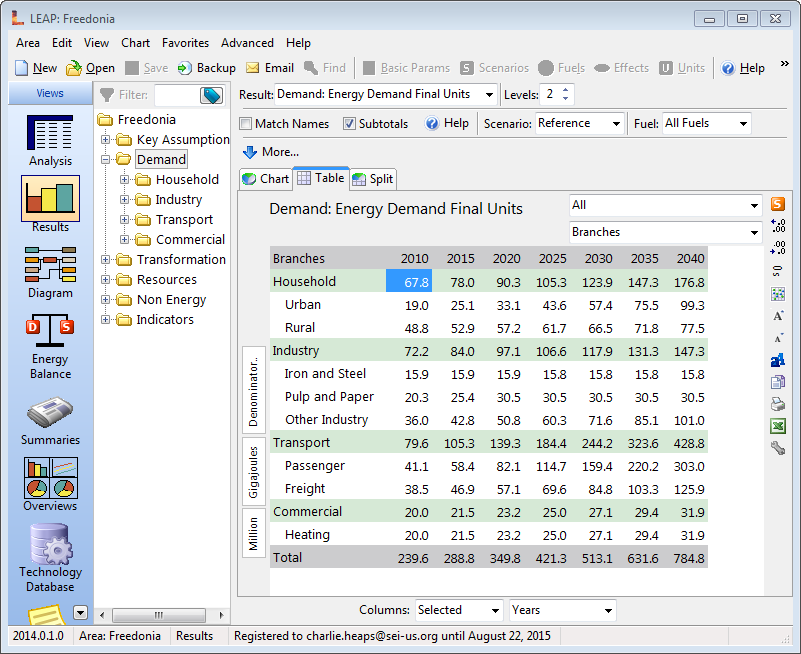
- Additional New Features in LEAP 2014:
-
Increased Security: LEAP's Executable files are now digitally signed to provide assurance that they are genuine and virus-free. Digital signing also helps to reduce the number of warnings shown during the downloading and installation process.
-
Improved Emailing of Data Sets: You can now share your LEAP areas via email directly from LEAP's main menu using two different protocols: SMTP and MAPI. SMTP has the advantage that no other software is required but may sometimes be blocked by firewalls on some networks. If you face this problem, you can send emails using the MAPI protocol, which uses many standard email clients that may be installed on your PC like Outlook or Thunderbird.
-
Unified Color and Font selection: Settings colors and fonts for charts and tables is now unified across all views, making LEAP simpler to operate. Two new buttons on all screens let you increase and decrease font sizes with single button clicks.
-
Enhanced User Variables: You can now mark User Variables as "intermediate" variables – i.e. variables that perform some type of intermediate calculation. In the Analysis View screen you can choose to hide these intermediate variables (or all User Variables) by right-clicking on the variable tabs.
-
LEAP's Autocomplete and Drag-and-Drop Expression-Building Tools have been improved to make editing of expressions much less cumbersome.
-
Better Multi-Region Modeling: You can now selectively show or hide Transformation processes in particular regions. You can also now import data from a single region LEAP area into a particular region of a multi-region model.
-
Thoroughly Revised and Updated Help: The help files have been thoroughly revised and updated to reflect all the new changes in LEAP2014 with improved formatting and additional pages devoted to describing important concepts such as capacity expansion planning in Transformation and the new tags feature.
-
Expanded Versions of Data Sets to Match Training Exercises: The included data sets are now split into more versions, each corresponding to a section in the LEAP Training Exercises. Use the Area: Revert to Version menu option to select among these different versions.
LEAP 2012
2012.056: 2/5/2014
- Fix to eliminate rounding errors (results were being stored in single precision - now double precision).
- Chart freeze-up fixed.
2012.055: 12/6/2013
- Fix to ensure data sets with invalid costing data open correctly.
- Fix to ensure error reporting works correctly.
2012.054: 12/6/2013
- Additional fixes to calculations addressing problems when comparing scenarios.
- Improvements to handle calculation order to ensure costs of saved energy are calculated correctly.
2012.053: 12/4/2013
- Fixed bug introduced in v52 that stopped the region select box in Analysis View from working correctly.
2012.052: 11/29/2013
- Fixed various bugs associated with Transformation capital cost calculations, which sometimes caused capital costs to be calculated incorrectly.
- Fixed a bug in which a reference to a variable in another branch sometimes returned the incorrect value.
2012.049: 6/14/2013
- Fixed bug causing crash when exporting or saving charts.
2012.048: 6/3/2013
- Improved Optimization Calculations using new compacted version of OSeMOSYS model:
much faster and much less memory required. Optimization calculations are now four-times faster and require about 75% less RAM memory. For example, in tests calculating the sample optimization exercise over a 60-year period, peak memory use declined from 336 MB to 74 MB, and calculation time declined from 21 seconds to 5 seconds.
- Improved Expression Builder: Inserting branch/variable references is now much more robust and supports multi-line expressions. Also fixed problems showing WEAP branches and variables in the branch/variable wizard.
- Updated Compatibility with WEAP (3.43) following significant changes in WEAP's API. If using WEAP in conjunction with LEAP, please update both WEAP
and LEAP to the latest versions.
- Fixed problems with charts not drawing correctly introduced in last version (have temporarily reverted back to older chart component).
2012.047: 5/11/2013
- Fixed bug preventing editing of notes in Scenario Manager.
- Fixed bug in calculations when specifying a load shape for each demand technology.
- Updated chart component: two new color palettes added for charts.
2012.046: 4/29/2013
Further Improvements to Optimization:- Renewable Portfolio Standard: Now supports specification of a Renewable Portfolio Standard (RPS) in optimization calculations: a target for renewable generation. At the module level you can specify a Renewable Production Target variable as a percentage of total production from the module. At the process level you can specify for each process, what fraction of production is qualified for the RPS target using the Renewable Qualified variable. For example, coal and oil would typically have a value of 0%, while wind and solar would have a value of 100%. Some RPS policies don't allow hydro and biomass to be included. A coal plant fired with 10% biomass might have the Renewable Qualified variable set to 10%.
- Addition Size/Mixed Integer Linear Programming (Experimental). You can also now set the minimum size of each capacity addition using the Minimum Addition Size variable. For example wind power plants may have a minimum size of just a few megawatts, while a nuclear power plant may have a minimum size of a many hundreds of megawatts, making. If set to zero, there is no minimum and the optimization calculations will use a faster linear programming approach. If non-zero, the optimization calculations use the much slower technique of Mixed Integer Linear Programming (MILP). You can globally enable or disable this variable on the General: Basic Parameters: Optimization screen (i.e. enable/disable MILP). To keep calculation times acceptably fast, it is recommended that you only enable this variable once you have fully debugged the rest of your energy system model.
- Minimum and Maximum Capacity Additions: You can now set minimum and maximum constraints for the amount of capacity added in a particular year. These variables are not to be confused with the Minimum and Maximum Capacity variables, which set overall limits on the capacity of each process.
- Improved Startup Code: fixes a problem when two different user accounts on a single PC are using LEAP to access a similarly named area in two different folders.
2012.045: 4/25/2013
- Bug fix: An error introduced in a recent update (2012.040) caused capital costs to be double-counted for a module in a scenario using optimization.
- Improved optimization to reduce likelihood of calculations failing with "no primal feasible solution" errors. New debug messages report if insufficient capacity was built to meet demands. The code has also been improved to properly erase "optimized capacity" expression at the start of a calculation. This helps users
to see when a calculation does not complete properly.
- Now supports multiple copies of LEAP running concurrently in different user accounts on a single PC. Previously, multiple copies of LEAP could only be used if running in a single account.
- Improved installation of the older Borland Database Engine (BDE). The BDE is not normally required in recent versions of LEAP, but is still utilized when updating LEAP data sets created in LEAP2008 and earlier. The changes reduce the chance of errors
occurring when running LEAP on non-administrator Windows accounts.
- Bug fix: in ReadFromExcel function: LEAP was incorrectly reporting that years were out of order when reading in time-sliced data from Excel.
- Bug fix: error when trying to select the denominator unit on the effects loading screen.
2012.043: 4/16/2013
- Bug fix: Fixed occasional crash when opening an area that was created on one computer and then moved to another in a different region.
2012.042: 4/15/2013
- Manage Scenarios: You can now sort the display order of scenarios in the Manage Scenarios screen.
2012.041: 4/10/2013
- Bug Fix: Fixed errors in User Variables screen when adding or reordering user variables.
- Added an error check to properly detect if GLPK optimization software is missing during calculations.
- Fixed standard areas installed with LEAP. In v40 the data sets were only partially completed versions of the areas.
2012.040: 4/9/2013
- Further Improvements to User Variables: User variables can now be assigned to categories to make them easier to organize.
Use the new Analysis: Variables: Variable Categories screen to view and edit the list of categories.
Color coding is now done for variable categories rather than for each user variable.
The User Variables screen has also been improved.
- Lower Initial Data Requirements: You can now calculate LEAP and display results before creating any scenarios, even if your Current Accounts only contains data for a single year.
This can be useful when using LEAP for teaching purposes since you can now check your results before creating scenarios.
It is also useful if LEAP is being used as a single year inventory tool. All Results views (Results, Energy
Balances and Summaries) now support showing single-year or multi-year results for Current Accounts only.
- Updated GLPK Solver: The GLPK solver used in LEAP's optimization calculations
has been updated from v4.34 to v4.48, which seems to make optimization
calculations about 20% faster.
LEAP also now automatically supports both 64 bit and 32 bit versions of GLPK.
On 64 bit systems this should lead to fewer out of memory errors.
Check LEAP's Help: About screen to see if your system is 64 bit. Most computers using Windows 7
are 64 bit. Earlier systems are typically 32 bit.
- 20, 100 and 500 year Global Warming Potential (GWP) Factors
are
now calculated.
Previously LEAP only supported calculation of 100 year GWP values. A
setting in the General: Basic Parameters: Scope screen lets you enable
calculation of all 3 sets of GWP values. By default, only the most
commonly used 100 year GWP values are calculated in order to keep LEAP's
calculations as fast as possible.
- Improved Display of Environmental Effects in Results View.
LEAP now displays all effects in a single table and makes it easier to switch among reports for individual pollutants.
The Results View screen has been simplified to make it easier to switch among different environmental effects tables.
- Optimization code now properly handles residual capacity: Existing capacity and future capacity commitments that you don't want to be optimized
are now properly handled in LEAP's optimization methodology.
In previous versions, the optimization routines wrote their results back into LEAP's
Exogenous Capacity variable so it was not possible for the user to specify future capacity exogenously.
Now, LEAP writes the results of its optimization calculations back into a new variable called "Optimized Capacity",
thus leaving the Exogenous Capacity variable free for users to be able to specify current and future capacity commitments.
This new approach is also much more compatible with how the Exogenous Capacity variable is used in non-optimized (simulation) calculations.
- Bug fix: LEAP sometimes reported an error of neighboring fuel shares not summing to 100%, even when the sum was
in fact correct.
- Bug fix: Bad expressions imported into LEAP from Excel were incorrectly being treated as an error when the unit was set to "No data".
Since these expressions are hidden they should be ignored.
- Feature Removed: The ability to allocate primary
energy and emissions back to demand branches for display in results has
now been removed. In some complex data sets, these calculations
were heuristic in nature and occasionally prone to producing
unreasonable results. I will try to reinstitute this feature in
the future depending on user feedback and if a more reliable and
transparent algorithm can be developed. Apologies for any
inconvenience.
- Various error messages improved, minor bug fixes and help files updated.
2012.037: 2/20/2013
- Fixed display issues in Analysis View caused by yesterday's release (2012.035). Sorry for any inconvenience.
- Allow Transformation variable First Simulation Year to be specified in scenarios.
2012.035: 2/19/2013
- Improvements to make it easier to see Notes when clicking on branches with no variables in Analysis View.
- Minor bug fixes for User Variables.
2012.034: 2/17/2013
- Bug fixes to the References screen.
- Increased maximum number of user variables from 100 to 400.
- Other minor bug fixes.
2012.033: 2/9/2013
- Further improvements to allow for more flexible specifications of User Variables.
2012.032: 2/4/2013
- Enhanced User Variables to allow variables at non energy categories. Also improved the ability to set the scope of user variables, by adding checkboxes for [x] on and [x] below named branches.
- Basic Parameters: Fixed an error that sometimes occurred when switching tabs.
- Ordering of non-energy branch categories now enabled.
- Main Data Table: Fixed bug which caused the expression field to sometimes be uneditable (displayed with a blue background). Also improved how the fixed left hand columns of the table are displayed.
- Improved the key variables, non energy effects, Transformation module and Transformation process properties screens to give instant feedback when entering an illegal name.
- Fixed error in Variable Aliases screen that can occur when there are no aliases.
- Fixed error when trying to create more than 20 User Variables.
2012.031: 1/18/2013
- Effects and Fuels: A newly updated default set of effects is now available that includes the complete set of high GWP gases as reflected in the IPCC Fourth Assessment report.
We have also added black carbon, organic carbon and PM2.5: useful in studies focused on
short lived climate pollutants (SLCPs). Twenty year GWP factors have been added for each pollutant (in addition to
the 100 and 500-year factors that already existed) and a new button allows you to quickly
switch among different sets of GWP factors as specified in each of the four
IPCC assessment reports. By default, the values from AR2 are used, reflecting the UNFCCC's
current reporting guidelines for countries doing national communications. The effects screen has also been updated for improved ease-of-use. It now allows for user-defined ordering of pollutants, has an improved dialog for adding new pollutants, better export to Excel and a new field that allows a
documenting URL to be specified for each effect.
The default set of effects are all linked via these URLs to the
Wikipedia pages documenting those pollutants. The fuels screen has also been updated with the addition of
a new URL field, and the default set of fuels are all now linked via these URLs to the
Wikipedia pages documenting those fuels.
- User Variables: The User Variables screen has been redesigned, allowing additional properties to be edited. You can now set the variable's
visibility
and different default expressions for both Current Accounts and scenarios. You can also set variables as being read only. The User Variable screen now gives immediate feedback on whether
variable names and expressions are valid, and it also links to the Expression Builder screen to help you write default expressions for each user variable.
To access User Variables, right-click on a variable tab in Analysis View or select menu option Analysis: Variables. You can then choose to edit or reset the properties of an existing variable or to add or delete a variable. You can also access the properties for all User Variables in a single summary screen.
- Built-in Variables: You can now edit some of the properties of built-in variables including the default expressions used for the variable and their minimum and maximum values. You can also indicate that a built-in variable is read only.
This will gray-out the expression in analysis view, preventing it from being accidentally edited. Right-click on a variable tab in Analysis view to access the screen for setting these properties.
- Variables in Analysis View: The main data entry table in Analysis
View has been improved to clearly shows expressions that are using their default values by marking them in gray text.
The description for each variable also now summarizes the variable's properties including whether or not the variable is time-sliced or read only and what is the variable's default expression.
As a reminder, the following color coding is used to indicate from where an expression is inherited:- Gray: the default variable expression.
- Blue: an expression entered explicitly in the scenario currently being edited.
- Green: in multi-region areas only, used to indicate an expression that is inherited from another region.
- Black: an expression that is inherited from another scenario.
- Red Italics: an invalid expression containing an error.
- Three New Functions:
- TotalSiblings(Branch:Variable): Allows you to get the sum of all variables at all siblings (immediate neighbors) of a given branch. This form can sometimes be useful when using TotalChildren does not work because a variable does not exist at both a parent and child branch.
- Add(time series expression): Adds (or subtracts) values to existing values. This function is useful for specifying capacity additions. The parameters to the add function can be the planned future additions (or retirements if negative) which will be added to any existing capacity. This function uses the same types of parameters as the Interp, Step and other time-series functions. Thanks to Francisco Lallana for suggesting this!
- DefaultYearlyShape: A simple function with no parameters to get data from the default (first) yearly shape.
- Fixed errors when reverting among different versions of an area or when upgrading older areas.
- Fixed locking/unlocking of branches: tree display was not being properly refreshed when a branch was locked or unlocked.
- Updated help pages to reflect above changes.
2012.030: 12/10/2012
- Various fixes for expressions linking to Excel spreadsheets: LEAP sometimes failed to read values from Excel files.
- Note: you need to be careful with file and range names when linking to Excel. Avoid using parentheses, hyphens (minus signs) and other math operators in file, sheet and range names. If you use such characters LEAP will not read the data correctly. I will try to make LEAP more robust in this regard in the near future.
- Pasting from Excel now ignores blank cells (rather than treating them as zeros).
- Fix to API to avoid error message about scripting being disabled in evaluation mode (even if using full working version).
2012.029: 12/8/2012
- Time-series wizard made much more robust. The wizard now properly handles expressions linked to Excel, those with growth rates and those referencing two different Excel ranges. Now also auto-adds years when you move the cursor below the last set of years/values. Editing and error reporting also improved and help file edited and fixed.
- Branch/variable popup screen fixed to properly include a % scaling factor when referencing variable with percent share and percent saturation units.
- Fixed exporting to Excel version 2003 and earlier.
- Now properly reports error if a growth parameter is used with a Step function.
2012.028: 11/29/2012
- Improved User Variables. Fixed handling of blank minimum and maximum values. Updated help on User Variables. Added tab color selector to General: User Variables screen.
2012.027: 11/24/2012
- Improved importing of values from Excel. Now handles (skips) cells with blank values and properly handles cells containing errors. Also features improved error messages.
2012.026: 11/21/2012
- Fixed problem calculating energy balances with negative statistical differences.
2012.025: 10/26/2012
- Fixed problem accessing values in Excel spreadsheets.
2012.024: 10/19/2012
- Fixed registration problems.
2012.023: 10/17/2012
- Fixed errors in time-series wizard, functions wizard and Results view when using LEAP in a language other than English.
- Updates for license registration code handling.
2012.022: 10/12/2012
- New: ability to color code user variables.
- Improved export to Excel: now sets frozen panes in exported sheets to make scrolling through tables easier.
- Updated optimization calculations to optionally support straight-line depreciation of capital costs.
- Fixed problem in optimization calculations: calculation of scenarios was not running for correct set of years (included the Current Account years).
- Fixed error when attempting to use optimization for multi-region areas (data file not being written correctly).
- Fixed bug in primary energy calculations that could cause negative values for indigenous production to be calculated in rare cases.
- Fixed bug in charts, that incorrectly showed charts saved in earlier versions in 3D.
2012.020: 9/23/2012
- Maximum number of User Variables increased from 30 to 100.
- Scope of variables can now be limited by specifying that the variable only appears on or below a particular tree branch. For example, a particular variable might only be used within a particular sectoral model.
- Redesigned the General: User Variables screen including new dialog for adding and editing variables, and a new ability to export all user variable data to Excel.
- New context sensitive menus for adding, deleting and editing user variables directly from the main menu. Right-click the variable tabs in the Analysis View to access these options. You can also show a dialog summarizing the properties of built-in variables.
- New properties added to specify default value/expression for a user variable and to specify if the variable is read only.
2012.019: 9/20/2012
- Fixed problem with registration information not being used when registering online after first registering offline.
- Fixed incorrect emissions calculations when using optimization combined with specifying efficiencies as heat rates.
- Improved endogenous capacity screen. Adding a new process is now done directly from the screen without the need for a separate dialog box.
- Fixed problem in endogenous capacity screen: Addition ordering was sometimes incorrect (i.e. not always 1, 2, 3,) Added code to check and fix ordering.
2012.018: 9/7/2012
- Error when entering time-series wizard if the expression in Analysis View contained an error.
- Time-sliced check box in Key Assumptions was not always properly enabled.
- Error when displaying some charts that have negative values.
- Error when entering an invalid expression in the "first simulation year" variable: and inability thereafter to let you fix the error.
2012.017: 8/31/2012
- Peak power requirements reported incorrectly in some data sets.
- Time-sliced variables sometimes not being displayed correctly in Current Accounts and some valid expressions shown in red indicating an error.
2012.016: 8/20/2012
- Better support for LEAP/WEAP linking: LEAP
now prompts the user when WEAP needs to be recalculated and then
recalculates WEAP from within LEAP (and vice versa if working in WEAP).
Also, LEAP now checks minimum WEAP version when linking and better
handles situations such as WEAP not being installed or WEAP not
properly linked to LEAP, etc.
Note: If you will be attending World Water Week in Stockholm, Sweden next week, please come to the formal launch of the WEAP-LEAP system on August 30th. Lunch will be provided. Details here. - Improved Manage Areas screen: Added new
columns summarizing the scenarios, regions and planning period of each area
and the size of areas on disk in megabytes. Added a table footer to show the
number of areas and total disk space used by all areas. Renaming,
deleting, archiving & unarchiving areas now much more robust. Handles
errors during archiving without losing data (e.g. if an Excel file
stored in an area is open in Excel when you try to archive). Added
exporting of areas information to Excel. Added option to backup all
areas to a single folder. Added ability to email an area from
within the Manage Areas screen. Added ability to specify which
past versions to include when backing up or emailing areas. Added
ability to sort the Manage Areas table by clicking on column headings.
- Improved Internet Updates: Now alerts you about
available updates on all PCs. Previously no alerts appeared on PCs
without administrator rights. On Windows XP or earlier, LEAP now warns
if you do not have administrator rights. For Windows Vista and later,
Windows User Account Control will automatically prompt users for the
administrator password during updates. LEAP also now alerts you to
restart LEAP after updates when not running in administrator mode - so
as to make your areas and registration information fully visible.
Note: you will only see the benefits of this changes on subsequent
updates.
- Added new "WEAP-LEAP Tutorial" data set: This
illustrates how LEAP and WEAP can be linked together for integrated
energy-water assessment. It is designed to accompany a new set of
training exercises that will be uploaded shortly to the COMMEND web
site.
Fixed issues with chart formatting: the Y0 option was not working properly. Also, improved drawing of past/future divider in charts and improved saving of settings in favorite charts. - New and improved API functions to support chart exporting and
WEAP/LEAP connections.
- Improved versioning and backups: no longer prompts to save before
restoring a version. No longer asks what versions to include if
area has no versions.
- Fixed issue with Backups: selecting "no versions" in backup caused
LEAP not to perform a backup at all.
- More flexible opening of areas: now allows you to try and open areas
created in newer versions of LEAP (forwards compatible).
- Improved calculation display to only show scenarios actually being
calculated and to show better prompt messages.
- Improved export to Excel operations to allow for cases where Excel
is running but unavailable (e.g. when Excel is in edit mode).
2012.014: 8/6/2012
- Performance improvements when using API.
- Fixed problems (e.g. showing results) when LEAP is translated into Chinese and other languages.
2012.013: 7/31/2012
- Performance improvements when deleting branches.
- Fixed intermittent error when saving.
- Improvements to code in TED database.
2012.012: 7/29/2012
The new release of SEI’s LEAP (Long-range Energy Alternatives Planning) system, used by thousands of organizations in more than 190 countries, includes multiple new features, performance enhancements, and close integration with SEI’s Water Evaluation and Planning system (WEAP) .
As always this version is backwards compatible with earlier versions. Data sets prepared in LEAP2011 can be read directly into LEAP2012. For those of you still using LEAP2008 or earlier who had issues in migrating to LEAP2011, LEAP2012 includes a number of improvements that allow it to better import and correctly work with these older data sets.
Detailed Description of New Features in LEAP2012:
- Tools for Energy-Water Nexus Modeling:
Water-energy trade-offs are rapidly gaining attention around the world,
and the new 2012 version of LEAP for the first time makes it possible
to explore these issues with powerful quantitative modeling tools. To
achieve this, LEAP has been closely
integrated with its sister model, WEAP, a leading water resource
planning tool, so that the two can be used together for integrated
energy and water resource planning. For more information, refer to this
introductory slide show
and this short demonstration video.
WEAP has similarly been enhanced to enable it to link to LEAP. The
combined suite of tools will be officially launched at an event at World Water Week in Stockholm on
August 30th, 2012. This feature will only become operational
once the new version of WEAP has been released in August, at which time
additional details and documentation will be made available.
- Improved Optimization Modeling: LEAP's optimization
modeling features have been further refined and updated to
use the latest version of the OSeMOSYS open source optimization model.
We believe these features are now ready for real-world planning and
analysis. However, further updates and fixes are likely as
OSeMOSYS continues to evolve and improve. In particular,
forthcoming versions of OSeMOSYS are expected to address its current
high memory usage, which can sometimes cause out of memory errors.
As always, we welcome feedback from users on any issues they identify in
using this feature.
- Better Modeling of Environmental Externalities:
Pollution costs can now be varied among scenarios and regions, and can
now be
specified using LEAP's standard expression-based modeling language.
This makes it possible to compare the costs of including or excluding
externalities on a single chart or table. In previous versions, separate
model runs would be required. Externalities are now entered under
the high level "Effects" branch of the LEAP tree.
- Improved Seasonal, Time-of-day and
Day-of-Week Modeling: LEAP's time slicing features have been
further improved, making it easier to model, for example, when wind or solar power is available
or
when households need power. The charts and tables in the Analysis View have
also been
improved to better display this type of information.
- New Energy Demand Modeling Methods: Energy demands
may now be defined directly, which is useful in some situations where it
does not make sense to specify demands as the product of an activity
level and an energy intensity. In addition, in areas
where electric load shapes are specified for individual demand
technologies, you can now choose to enter demands for each time slice (as
opposed to specifying a total annual energy demand and a load shape).
These demands can also be entered either as energy per time slice or as peak power
requirements in the time slice.
- Simpler Editing of Demand Branches: The Demand
branch properties screen has been completely redesigned. It is now much
simpler whilst also supporting additional methods.
- More Flexible Results Aggregation: Results can now be
aggregated into different groupings, both across regions and fuel types.
For example, SEI’s recent global energy model, built in LEAP, modeled 22 global regions, while results were presented for each of
these regions as well as being aggregated across 10, 6 and 3 macro
regions.
- More Beautiful Charts: The appearance of
LEAP's charts has been greatly improved while LEAP's chart exporting
capabilities have also been strengthened so that charts
can now be exported in high resolution for direct use in desktop publishing
software. The Chart Options screen also features better exporting
to PowerPoint and the return of support for background images. To
this end, LEAP also now includes a small library of open source images
related to energy consumption and production technologies, which can be
used as backgrounds to LEAP's charts. You can also use any other
image of your own.
- New Favorite Charts Manager: Managing charts in
Results View has also been made much easier with the addition of a new
screen designed to help you group and manage your favorite charts.
Favorite charts can also now be organized within folders.
- New Variable Aliases: A new Variable Aliases
feature lets you define shortcut names for longer, commonly used
branch/variable expressions including scaling factors and units. For
example, for the long expression Key/GDP[Billion US$] you could create an
alias GDP. The use of variable aliases helps make your models easier
to read and to edit.
- Better Backup and "Save As": LEAP's Backup option
has been improved and made more accessible. It is now available
directly from the main screen's toolbar and it now
supports the latest Windows Vista/7.0 file dialogs (as well as simpler
dialogs on older operating systems). The ".leap" files created during a backup can now
(optionally) be made to include previous versions of an area, including those
you have created yourself and those that are created automatically by
LEAP. LEAP's Save As function now works in
the same way as other standard software tools. That is, you no
longer need to save an area before you can use it.
Instead it lets you save a copy of the current state of your area under
a new name, while preserving the older version in its last saved
state.
- Improved Language Translations: The handling
of text in LEAP's source code has been thoroughly updated to make creating new translations much
easier and clearer. SEI will be working with partners and volunteers to
create updated language translations in the coming months. Other
improvements include the new ability to translate the names of fuels,
effects and units.
- Windows 8, Apple and Linux: LEAP has been updated
and tested to work with the new prerelease version of Microsoft's Windows 8
Operating
System (due around October 2012). We are currently also testing and
adapting LEAP to work well within the WINE environment. This
will enable it to be used on Apple and Linux systems. Stay
tuned for more news on this topic.
- Improved Region, Effect, and Unit screens: Each of
these screens have been improved, with the addition of support for exporting to Excel and new notes fields for better
documentation.
- Improved Installation and Startup: LEAP's
installation and startup routines are now more robust.
- Analysis View Interface Improved:
- User-defined variables are now color coded o make them distinct from LEAP's built-in variables. Their tabs in the Analysis view are colored light blue.
- Dragging-and dropping of branches to create expressions has been improved and made more intuitive.
- You can now filter the years in Analysis view charts: showing results for all years or for every 2, 5, 10, or selected years (similar to the way charts work in Results view).
- The One Branch box used for filtering charts has been removed and replaced with a selection box above the data table, which is used for selecting a branch in both the data entry area and in charts.
- The behavior of the scenario and variable selection boxes has
been fixed.
- Improved Results and Overviews. Overview charts can
now be dragged and dropped for quick reordering. In addition, overviews
now properly draw all types of charts including pie and radar charts. In
the Results view, chart titles have been improved and yearly charts can
now be configured more easily by directly selecting results every 2, 5,
or 10 years without the need to enter a separate dialog box.
- More Included Examples: The LEAP installation now
includes multiple areas. In addition to Freedonia, the installation also now includes a Transport stock turnover
model, an example of an optimization model and the area used with
LEAP's GHG Mitigation Training Exercises. Most of these areas
include multiple versions of the data sets, so that users can quickly
access the answer keys to LEAP's training exercises.
- Better Versioning: The ability to revert to
earlier saved versions of an area is now directly accessible from the
Area menu on LEAP's main screen. This makes it easier to select
among versions saved as answer keys to exercises (see above).
- New Functions and Improved Functions Editing: LEAP
2012 includes a variety of new functions. The RegionValue, ScenarioValue,
RegionGrowth, and ScenarioGrowth functions allow values or growth rates
to be specified relative to the trends seen in other regions and
scenarios. The Sum and NPV functions are used for summing across one or
more years of a given branch (straight sum or discounted sum). For
more information on these functions refer to LEAP's help files.
LEAP's built-in function editor has also been improved with the addition
of new preset types of parameters and a better and more robust interface.
- LEAP 2012 also includes numerous bug fixes, updated help
and an expansion of the LEAP
Application Programming Interface (API). The API has
been expanded to support the new LEAP/WEAP modeling features.
Key bug fixes to note include:
- More robust communications with Excel and other MS-Office software. LEAP now properly checks whether Excel is available and properly handles cases where they are busy or otherwise unavailable.
- Fixed an important units conversion bug: the conversion factor for energy values entered in cubic feet was incorrect.
LEAP 2011
2011.044 5/10/2012
- Fixed range error in Transformation calculations.
2011.043 2/13/2012
- Fixes to address range errors and access violations when editing time slices and yearly shapes.
2011.041 2/1/2012
- Fixed start up problems that sometimes caused LEAP to try and use the root folder for LEAP areas and settings.
2011.040 12/5/2011
- Minor bug fixes for API.
2011.039 11/11/2011
- Fixed two bugs introduced in last version: (1) error when viewing General: Effects screen, (2) Process share variable sometimes hidden even when needed.
- Improved diagnostics messages in Results view (when using optimization).
2011.038 11/9/2011
- Fixed problem in optimization calculation. When using large numbers of time slices, time sliced values were not being written to the OSeMOSYS data file with sufficient precision.
- Simplified Transformation screens to hide unused variables. For example, depending on the dispatch rule, the Process Share and Historical Production variables will be hidden.
- Optimization now takes dispatch results directly from OSeMOSYS. This simplifies data entry screens since the dispatch rule no longer has to be set.
- Bug fix: not correctly calculating Transformation module co-products.
- Bug fix: not honoring if you changed the LEAP areas folder location in the Basic Parameters: Folders screen.
- Fixed quick help definition of heat rate variable.
2011.037 10/7/2011
-
Fixed problem when installing updates via the Help: Check for Updates feature.
2011.036 10/6/2011
-
Various improvements related to automation of LEAP.
2011.035 10/5/2011
-
Fixed errors when adding indicator branches.
2011.034 10/4/2011
-
Fixed expression inheritance issues in Endogenous Capacity screen. The list of processes was not being properly inherited from parent scenarios.
-
Fixed problems importing from earlier v2008 format data files, which was causing some data to be improperly imported or lost.
-
Improved chart labeling in Analysis view when showing results for only a single branch.
-
Fixed problems drawing charts for time-sliced variables.
-
Fixed error messages in Yearly Shapes screen.
-
Fixed problems when using non-English formatted numbers in the General: Basic Parameters screen.
-
Improved API to allow results references to be filtered by fuel, gas, and region.
-
Fixed various bugs in the script manager.
-
Scripting now disabled in evaluation version.
-
Fixed branch hiding/showing for multi-region data sets.
-
Various changes to eliminate obsolete components and prepare for update to new version of Delphi.
-
Fixed various minor problems in the TED view.
-
Fixed printing of TED Tree.
-
Fixed problems dragging main LEAP window on systems with multiple monitors.
2011.033 8/19/2011
-
Fixed calculation errors with checksums.
2011.032 8/17/2011
-
Fixed range check error when using Remainder function in complex Key Variable folder structures.
-
Fixed problem when using heat rates to specify efficiency data in conjunction with the OSeMOSYS optimization model.
-
Minor fixes to new Time Slice setup wizard.
2011.030 8/16/2011
-
Fixed occasional crashes during startup (previous fix in v29 did not fully address the problem).
-
Improved generation of time slices. When using the Time Slices: Setup feature a new screen allows you to automatically generate and set the names for simple sets of time slices (those without seasonal/time of day information). You can also continue to use the more advanced wizard for generating sets of slices that do include seasonal/time of day information.
2011.029 8/16/2011
-
Improved user variables: new option lets a user variable be specified only at the Key Variables branches.
-
Improved HistoricalGrowth function to allow use of 4 year parameters.
2011.028 8/8/2011
-
Fixed problems interpreting expressions referencing Excel spreadsheets. The problem caused an error message about LEAP being unable to find the specified spreadsheet file.
-
Fixed issue where expressions edited in one of the helper wizards would be improperly discarded when moving to a new cell in the main data entry table.
-
Fixed various other issues when editing/parsing expressions and improved operation of function editor.
2011.027 7/26/2011
-
Fixed problem in calculations when load shapes are specified for each device.
-
Improved performance of setup wizard in the General: Time slices screen.
-
Various fixes to API.
2011.026 7/19/2011
-
Fixed scaling factor problem with Key variables.
-
Fixed expression parsing problem in complex "IF" expressions.
-
Updates to LEAP API including more robust startup/shutdown of LEAP when under control of other programs.
-
Fixed overviews in default Freedonia data set and revised list of favorite charts.
2011.025 7/8/2011
-
Sample area (Freedonia) updated to use 2010 as base year and to properly reflect the assumptions and text in the latest training exercises.
-
Fixed editing problems in Notes view.
-
Fixed issue where LEAP would fail to start if root working folder was deleted.
-
Improved behavior if Windows scripting languages missing.
2011.024 7/5/2011
-
Improved Installation and Operation for Standard (Non-Administrative) Users. Installing LEAP installation still requires full administrative rights, but now running LEAP does not. Importing old (pre-2011) datasets is not supported for any users other than the original account with administrative rights. To support this new functionality, the LEAP settings folder has been moved so that it will now be separately generated for each account. It is now located at "_LEAP Settings" under the "LEAP2011 Areas" folder. Note that the first time LEAP is run by non-administrative users an error message will normally be reported by the BDE - the Borland Database Engine ("Unable to merge changes") . This message can safely be ignored. The BDE is only used for importing older data sets.
-
Return of the Tabbed Expression Builder: Users told us that they strongly preferred having the Expression Builder located on a tab in the Analysis View (as in LEAP 2008) so it has been retuned now to that location. The new tabbed expression builder offers significant improvements over the older version including support for "check as you type" error checking, and quick access to the branch/variable picker (Ctrl+B), the function wizard (Ctrl+F) and the Time-Series wizard (Ctrl+T). You can also use Ctrl+Space when the cursor is placed within a branch/variable reference, function, or time-series to reopen the appropriate wizard, pre-populated with the element under the cursor.
-
Improved Importing of Older Areas: Numerous bug fixes to ensure that older data sets import better and function properly in LEAP2011. Added new routine that runs after a data set is updated that scans branch, fuel , region and effect names to detect and fix any conflicts with LEAP's reserved names for functions and variables. We have also restored an important feature from version 2008 whereby if LEAP crashes then on subsequent use it will prompt the user to select the area to be opened. Tip: before importing an area into LEAP2011 we strongly suggest that you first make sure it has been upgraded for use in LEAP2008. Then save it as a .leap file for import into LEAP2011.
-
Improved Internet Connectivity: Now lets the user edit the port for email ad FTP communications and optionally specify a Proxy Server (required by some firewalled networks).
-
Improved Error Reporting: better error messages, more detailed reporting on circular branch/variable references.
-
Shared Folders: Added a new shared folder setting that lets teams share areas for quick installation of .leap files. Set the shared folder in the General: Basic Parameters: Folders screen.
-
Bug Fixes:
-
Problem downloading and installing areas from Internet.
-
Fixed issues interfacing with OSeMOSYS model. OSeMOSYS does not support accented characters or non-US English number formatting. LEAP now ensures that data written to OSeMOSYS is in the correct format. It also makes sure that the batch file used to run OSeMOSYS works correctly even if the path contains accented characters.
-
Edit/Cut not working.
-
Crash when using BaselineValue function in Current Accounts.
-
Total Activity variable not available at some branches.
-
Feedstock category icon wrong when first created.
-
Inserting branches from another area caused a key violation error.
-
Calculation error if a time slice has zero hours.
-
Coping/pasting branches not prompting the user correctly. Also, copying/pasting of branches was not working efficiently leading to very high Branch IDs and occasional out-of-memory errors.
-
Fossil reserves not being properly drawn down in calculations.
-
Range errors when selecting a yearly shape, when editing data in some data tables or when switching to Summaries view after opening another area. OK
-
The Basic Parameter check box marked “Count Costs to End Year” was not being honored. LEAP was using the last costing year even if it was checked was on.
-
Fuel share variable visible in non-Current Accounts scenarios when doing useful energy calculations. It should be hidden as the data is not used.
-
Chart X axes were sometimes wrong in results. Showed numbers rather than proper labels.
-
Yearly shapes not drawing properly if PC was using non-English formatted numbers.
-
Enabling/disabling of total column and other indicators not working correctly in data and results tables.(total column was disabled but always selected.)
-
Total column not calculated correctly and percent charts not drawn properly when showing percentage values with pie charts.
-
Last line of summary report should not show costs of avoided GHGs if a scenario has more emissions than counter-factual (baseline) scenario. Also, report: title not properly showing the counter-factual scenario name.
-
Automatic running of Windows Regional Language Control Panel applet not working.
-
Resource costs charts incorrect due to problem with units conversion in display routines.
-
Units form was cutting off text in the final column.
-
Stop showing "per no data" columns for activity level data.
-
Line break character sometimes prevented expressions from being properly evaluated.
-
Problem with scale/units selection in branch/variable picker.
-
Units and scaling data not being properly used with import/export targets on Output fuels.
-
Improved upgrading from old format areas (pre v2011). Now checks if user has full administrative privileges before attempting to upgrade a data set. If not the user is informed that upgrading is not possible.
-
Problem with mantissa and exponent functions. They were being calculated using a natural log base. Now use base 10. Also, better error checking to avoid floating point errors with some trigonometry functions.
-
Added missing functions to help and function wizard.
-
Problems in Functions Wizard including preview of result not working.
-
Problems parsing complex functions (e.g. complex IF functions).
-
2011.019 6/8/2011
- Discount rate not being saved.
- Key violation Error while importing hourly load data in Yearly Shapes screen.
- Error when clicking on Analysis view data table when displaying hourly shape data.
2011.018 6/5/2011
- Bug fix: LEAP not recognizing scaling factors on Transport stock and sale variables.
2011.017 6/3/2011
- Error during primary energy allocation calculations.
- Fossil reserves not being calculated correctly.
- Areas were not being opened after being installed.
- Right-clicking did not select tree branch - so properties shown for wrong branch.
- Transport analysis stock and sales variables not visible at top level demand branches.
- Merit order variable not visible in non Current Account scenarios.
- Improved error reporting.
2011.016 5/27/2011
- Improved load shapes. You can now specify alternative load shapes in each scenario. The System Peak Load Shape/System Energy Load Shape variables are now available both in Current Accounts and all scenarios.
- Bug fix: Fixed range errors during calculation in some data sets.
- Bug fix: language translations were not working in version 2011 update.
- Updated help to better document load shapes.
- Other minor bug fixes.
2011.014 5/17/2011
- Bug fix: LEAP was not correctly reporting if the old BDE database engine was not installed. The BDE needs to be installed for LEAP to be able to convert old format data files.
- LEAP2011 installation updated to include the BDE database engine (only required when converting old format data sets).
- Note: if you are having problems installing old format data files (including the starter data sets on the LEAP web site), this is most probably because you installed LEAP on a new PC that did not have the older version (2008 or earlier) of LEAP installed. To resolve this, do a full download of LEAP2011.014 or later. Using Help: Check for Updates in LEAP will not resolve this issue.
2011.013: 5/13/2011
- Improved expression handling to better support some data sets created in older versions of LEAP.
- Improved handling of years in Results View when only saving results every N years (2, 5, 10, etc.).
- Improved operation of map view.
- Improved animation of charts.
- Fixed bug with source code information not appearing in new error reports.
- Minor bug fixes and further updates to help.
2011.012: 5/7/2011
LEAP2011 adds major new features including least cost optimization capabilities, improved modeling of seasonal and time-of-day variations in energy demand and supply and a new file format. This new version also includes an improved user interface that is less cluttered and easier to use than previous versions, while at the same time being immediately familiar to current users.
This new version of LEAP installs in a different folder than the existing version. You can continue to use the older version alongside the newer version, and you can also run both simultaneously so you can compare results. The new version of LEAP will also automatically make backup copies of your existing data sets and upgrade them to the new file format. Upgrading is a one-time process that takes approximately one minute.
Because LEAP2011 is a major new version with a new file format, it requires a full download and installation. The in-application “Check for Updates” option in LEAP version 2008 will not work.
Detailed Description of New Features in LEAP2011:
- New Least Cost Optimization Calculations: LEAP 2011 includes a new method for calculating capacity expansion and dispatch in Transformation scenarios using a least-cost optimization approach. This option works with the new Open Source Energy Modeling System (OSeMOSYS) and the open source GLPK linear programming library to calculate least cost capacity expansion scenarios, with or without emissions constraints. OSeMOSYS has been developed by a coalition of organizations including SEI, the International Atomic Energy Agency (IAEA), the U.N. Industrial Development Organization (UNIDO, the UK Energy Research Center, the Royal Technical University of Sweden (KTH), and others. See the OSeMOSYS web site for more information about OSeMOSYS or refer to the new Quick Start Guide to Using Optimization in LEAP.
- Improved Modeling of Seasonal and Time-of-day Variations in
Demand and Supply: LEAP 2011 has greater flexibility in
specifying seasonal and time-of-day load shapes. It includes a new time
slice setup wizard that lets you easily generate a wide range of time
slicing arrangements. Time slices can daily, weekly, monthly or seasonal
and may be further subdivided into days vs. nights and weekdays vs.
weekend days. You can create libraries of load shapes using these time
slice schemes, either by entering data manually or by importing data
from standard hourly load shape profiles, such as those available from
Itron and other companies.
- New File Format: LEAP 2011 uses a new file format,
which is less prone to data corruption, allows running of multiple
copies of LEAP simultaneously, uses Unicode to fully support any
language (including those with complex characters like Chinese,
Japanese, and Russian) and will allow for the development of future new
capabilities such as multi-level undo, as well as multi-user and web
based versions of LEAP. It also eliminates LEAP's reliance on the
obsolete Borland Database Engine (BDE) and provides for more reliable
installation and improved operation with newer versions of Windows.
- Improved User Interface: LEAP 2011’s screens have
been refined to reduce screen clutter and make them more consistent and
easier to use. User interface elements have also been refined to make
entering and selecting data easier. For example, where appropriate,
selection boxes now highlight most recently used (MRU) items at the top
of each list while lists have been alphabetized to make them easier to
select among.
- New Data Entry Tools: New tools help you to create
consistent data and models much more easily. These include:
- The Function Wizard (Ctrl-F), which helps you
to create mathematical expressions in an easy-to-use popup window.
The wizard provides detailed help on each of the parameters required
by each of LEAP’s 200+ functions. It also provides quick selection
boxes to help you choose valid entries for each parameter.
- Check-as-You-Type Error Checking is now
available wherever you enter an expression. This feature provides
instant feedback by highlighting errors in your expressions in real
time and informing you of any problems.
- The Time-Series Wizard has been improved to
support all time series functions. It also includes a new expression
preview.
- The New Branch/Variable selection box makes it
easier to embed references to other variables in your expressions.
You can also simply drag a branch from the main tree into the main
data entry table if you wish to create a reference to a branch in
the tree.
- The Expression Builder screen has been improved
and simplified, making it easier to write complex expressions in
cases where the Analysis View data entry table does not provide
enough space to easily edit an expression. The Expression Builder
now works as a popup box attached to each expression in the data
entry table. It fully supports Check-as-you-Type error checking, the
Functions wizard and all the other new data entry tools.
- The Function Wizard (Ctrl-F), which helps you
to create mathematical expressions in an easy-to-use popup window.
The wizard provides detailed help on each of the parameters required
by each of LEAP’s 200+ functions. It also provides quick selection
boxes to help you choose valid entries for each parameter.
- Improved Cost Analysis: LEAP 2011 provides more
powerful cost analysis including the ability to specify different
methods for annualizing capital costs, better handling of salvage values
and decommissioning costs and new reports that compare the costs of
operation of supply modules to the revenue generated from energy sales
(i.e. their profitability).
- Improved Error Reporting: LEAP 2011 now displays
detailed source code information should an error occur in LEAP. This
will make debugging easier in future. When reporting errors that require
you to edit the Area’s Basic Parameters, you will be given the choice to
go directly to the General: Basic Parameters screen to fix problems.
- An Improved Scenario Manager makes it easier to
manage scenario names and abbreviations. The Scenario Manager’s layout
has been improved to better highlight scenario names and abbreviations,
and a new area summarizes the expression search order among scenarios.
Examples have been added to help to provide better explanation of how
the expression search algorithm operates.
- Improved Results Reports. The results view features
simplified and reorganized selection boxes and quicker chart updating.
- Improved Bibliographic References: The References
screen has been improved with a better layout, the addition of new
fields (publication type, journal, volume, start and end pages) and the
ability to export to the standard RIS format used by standard
bibliographic software such as EndNote or Zotero.
- More Flexible Dispatch Modeling: Transformation
dispatch rules can now be varied between scenarios. Previously you had
to choose an approach common to all scenarios.
- Full support for International Languages.
Previously LEAP's software screens supported complex character sets
(Chinese, Korean, Greek, Cyrillic, Arabic, etc.), but text data such as
branch, fuel and region names could not reliably be specified in these
languages. LEAP now fully supports Unicode text so that all text data
can be entered in LEAP in any character set.
- Improved Diagram View: The Diagram view now shows
energy flows by default from left-to-right. A right-to-left layout can
also still be displayed.
- Improved Summaries View: The cost-benefit summary
report now shows savings in terms of CO2 equivalent emissions avoided
rather than Carbon equivalent emissions. Also, the report no longer
discounts avoided CO2.
- Improved Performance: While most data sets take
about the same time to calculate as in the older (2008) version, LEAP
2011 has been significantly improved in terms of how it calculates multi
regional data sets. Now, if you make a change to data affecting only a
single region and a single scenario, then only that single
region/scenario combination will need to be recalculated when
redisplaying results. Previously all regions were recalculated. In this
situation, recalculation times can be reduced enormously. For example in
a data set containing 27 regions we found that calculation times are
reduced in most circumstances from about 10 minutes to less than 1
minute. In addition to faster recalculations, most results view charts
and tables now update more quickly.
- Numerous bug fixes, updated help and expansion of the LEAP Application Programming Interface (API).
LEAP 2008
2008.096: 4/5/2011
- Minor Update: Makes sure this older version of LEAP properly reports an error when trying to install a data set developed in LEAP 2011. Also prevents 2011 format data sets from appearing in the Area: Open menu. This new version is recommended for anyone planning
2008.090: 9/9/2010
-
Corrected problem when exporting tables to Excel under certain non-English regional/language settings. Quote marks were incorrectly being placed around numbers.
-
Relaxed installation requirements to allow LEAP to be installed on PCs with any screen resolution.
2008.085: 8/4/2010
-
Improved Memory Management. On some data sets with large numbers of regions or scenarios LEAP was crashing with an out of memory error. Memory management has been greatly improved which should prevent this from happening.
-
Improved scenario inheritance feature: LEAP has for a long time had the ability for scenarios to inherit their expressions from multiple other scenarios. Specifying secondary scenarios allows you to create packages of scenarios that combine mini-scenarios into a single package (e.g. one package for transport policies or one for all efficiency measures). However, until now it was not possible to further combine multiple packages to form an overall scenario (i.e. packages of packages). This has now been fixed. You can use this new feature to combine packages of transport, industry, buildings and supply policies into an overall mitigation scenario.
2008.083: 6/9/2010
- Improved Allocation of Emissions: Added ability when allocating GHG emissions back to enery demands to list emissions either according to the demand fuel whose consumption drove the emissions or the supply fuel whose combustion actually resulted in the emissions. See Option marked "Alocate emissions to demands" on the General: Basic Paramteres: Scope screen.
2008.080: 5/3/2010
-
Improved Excel(filename, rangename) expression function. Now, in addition to importing values from Excel this function will also import from LEAP expressions entered in Excel. This allows you to store and manipulate your LEAP expressions in Excel.
-
.XLSX support: LEAP now supports both .xls spreadsheet files and the newer .xlsx file format introduced in Excel 2007.
-
Improved Copy and Paste. While LEAP has long supported copying ranges of data in Excel and pasting them into LEAP as Interp or Step functions, you can now also copy an Excel cell and then paste it into LEAP as a link to that Excel cell. Use Ctrl-Alt-V or Edit: Paste Link to paste a link to an Excel cell. Note that you can only paste links to spreadsheets that have previously been saved (i.e. not to in-memory spreadsheets).
-
Improved the Analysis: Import from Excel menu option. You can now import from a template spreadsheet and use it create links to a set of LEAP expressions stored in the spreadsheet. In this way you can quickly set up a LEAP area in which all expressions are stored and managed in Excel.
-
Improved Error Handling. If LEAP detects a corrupted file or fails to open an area, that area will be marked for repair. Next time LEAP is opened, the files in the area will be checked and, where possible, repaired.
-
Improved LEAP's Application Programming Interface (API). The API now provides an Area.Backup procedure to backup an area to a named folder.
-
Fixed a bug in the Help: Check for Updates feature that was preventing it from working on pre-Windows Vista systems.
-
Improved Script Security. A new tab has been added to the General: Basic Parameters screen marked "Script Security". Use this tab to control how scripts run on your computer within LEAP. Scripts are files that contain visual basic code that is executed on your computer. Bear in mind that scripts might contain malicious code that can damage your PC. For example, a malicious script could delete files, infect your PC with a virus, or take control of your PC. Hence, you should only allow scripts to run if you received your LEAP area from a trusted source or if you created it yourself. The default setting for scripts is that LEAP will ask you to grant permission the first time a script is to be executed. Thereafter, LEAP will add that script to the list of approved scripts to be run for a given area. For maximum security you can tell LEAP to never run any scripts. You can also tell LEAP to run all scripts without asking. This last setting is the least secure and is not recommended.
-
Changed the Help: Register and Help: Register Online menu options so that they are always visible, even if a user has already registered.
-
Redesigned Calculations for allocating Transformation energy use and GHG emissions back to demand branches. These calculations are now more realistic under a wider variety of Transformation configurations and are also much faster. Instead of slowing down calculations by a factor of 2 or 3 they now only cause a negligible slowdown. You can include this type of calculation by going to the Scope tab on the General: Basic Parameters screen and checking the box marked "Allocate Primary Energy..."
-
Improved Title Captions in Results charts to make them less confusing and added a visible title by default to all Results view charts. The title can be hidden by right clicking on a chart and unchecking "Show Chart Titles".
2008.079: 4/3/2010
- Fixes and improvements to the LEAP update feature. The updater has been improved to include a link to the "What's New?' page of the web site. Also, it was not properly updating help files and sample data. Various other issues have also been addressed that caused incorrect status messages.
2008.078: 3/29/2010
- Revised Transformation calculation to better handle auxiliary fuel use in situations where a process consumes some of the same energy it produces (e.g. own use of electricity in power plants). Previously auxiliary fuel use required LEAP to do iterative calculations of the entire Transformation system and you could not specify that auxiliary fuel use was provided directly by the same process consuming the auxiliary fuel. Now, you can specify that auxiliary power comes from the same process. To set-up LEAP to reflect this situation, go to the Calculations tab of the General: Basic Parameters screen and check the box marked Meet auxiliary energy needs from outputs of same process where possible. A benefit of this new method is that it reduces the need for iterative calculations, making LEAP's calculations more robust and faster.
- You can also optionally check another box on the same Basic Parameters screen marked Also derate capacity additions. This will automatically derate the capacity value of those processes in which the auxiliary fuel use is met from process outputs. If those processes are listed as options the Endogenous Capacity screen, then LEAP will automatically derate those processes to reflect the fact that only some of their output goes to meet the demands on the module. This in turn will force LEAP to build greater amounts of capacity for a given reserve margin.
- Expanded and improved help to reflect recent changes to the Auxiliary fuels calculations and the basic parameters screen.
2008.077: 3/17/2010
-
Added checking for duplicate neighboring branch names. By default duplicate neighboring branch names are now marked as an error and will causes LEAP's calculations to halt. You can change this behavior by setting an option in the General: Basic Parameters: Calculations screen. If not flagged as an error duplicate neighboring branch names will instead be highlighted with a warning message in the diagnostics screen.
-
Added a check for situations where a Remainder function is used in expressions in conjunction with a saturation unit in activity level variables. This is now marked as an error.
2008.076: 3/16/2010
-
Improved code completion in the script editor. When typing a period after an object, LEAP now pops up a box showing all of that object's properties and methods. The popup box includes documentation for each method including the list and type of any required parameters. LEAP can now deduce the type of all variables assigned to LEAP objects enabling code completion to work in most situations.
-
Reorganized the basic parameters screen.
2008.074: 2/27/2010
-
Fixed issues preventing LEAP from running correctly when User Account Control (UAC) is on in Windows 7 or Windows Vista. If you are having problems running LEAP with UAC, fully reinstall LEAP by downloading and running the complete install package (i.e. - do not update from the Help: Check for Updates menu). You can also manually set read/write security privileges for non-admin users on the "\ProgramData\LEAP Setttings" folder. This problem was exacerbated in version 2008.073, which used a new version of the installation program.
-
Adjusted calculations for stock changes to better match IEA energy balances.
2008.071: 2/10/2010
- Support for new Windows 7 interface feaures such as jump lists and taskbar progress indicators. The jump lists appear in the Windows 7 Start Menu or when right-clicking on LEAP in the taskbar. They enable you to quickly jump to a particular LEAP view or a recently opened LEAP area. Jump lists only work in Windows 7, they are not visible in Windows 2000, XP or Vista.
2008.070: 1/6/2010
- Fixed auto-registration of ".leap" files. You can double-click a LEAP file to launch LEAP and install a new area.
- Updated code for zipping/unzipping areas to fix problems and improve speed of operation.
- Added support for dragging and dropping “.leap” files into the LEAP application as an alternative way of installing an area.
2008.069: 12/7/2009
-
Support for Windows 7: LEAP has now been tested and found to work correctly under Windows 7.
- Two new types of charts: Two new types of charts have
been added in Results view: wedge charts and charts showing
avoided energy/emissions in one scenario versus another.
- Wedge Charts show one scenario as a time-series line with reductions coming from each sector, region or fuel as colored "wedges" below that line. Hence the lowest line in the chart is the time series of values in a second scenario: i.e. the first scenario minus all of the wedges. See example here: http://tinyurl.com/y9snxx5 To select this type of chart in Results view, pick results for one scenario (e.g. a mitigation scenario), and organize the chart to show years on the x axis and regions, fuels or branches on the legend. Click the "more" button in the toolbar then choose "show wedges vs. baseline" (or some other scenario). Wedge charts always appear as area charts and can be shown for most variables but make most sense for energy and emissions results.
- Avoided Energy Charts (i.e. Efficiency)
summarize the trend in a variable
in a given scenario (e.g. energy use over time in a mitigation scenario) as
a bar chart. You can now choose to have an additional series showing the
energy avoided compared to another scenario, displayed as a special series
of bars shown with a dotted line border. Typically these charts are used to
display energy demand results so that avoided series shows the energy
efficiency gains of one scenario versus another.
See example here: http://tinyurl.com/yblgbgm
To select this type of chart in Results view, pick results for one scenario (e.g. a mitigation scenario), and organize the chart to show years on the x axis and regions, fuels or branches on the legend. Click the "more" button in the toolbar then choose "show avoided vs. baseline" (or some other scenario). Avoided charts can be shown for most variables but make most sense for energy and emissions results.
2008.067: 9/1/2009
-
Enhanced favorites feature: now has option to save the title/subtitle of chart for use in the print/export screen.
-
Improved API to support manipulation of charts and to better support exporting of charts. Added ability to change units, regions, scenarios, years for a selected (favorite) chart before exporting it. Added new methods: ActiveUnit, ActiveScenario, ActiveRegion, ActiveYear, ResultsXAxis, ResultsLegend. See updated help file for full details.
-
Made code more robust to handle situations when _work folder runs out of space.
-
Transformation feedstock fuel shares could not be shown as stacked bar or area charts.
-
Improvements to map display: user ca now manually set the min and max values for colors.
-
Added two new downloadable examples for CHP (CHP Demand and CHP Supply).
2008.065: 8/3/2009
-
New Find Screen for searching for text in branches, expressions and notes or for searching for the branches where particular fuels are used. The results of each search are displayed as rows in a table in the lower part of the Find window. You can double-click a row in the table to jump to that data in LEAP's Analysis or Notes views. You can make your searches case sensitive and you can search for whole words or parts of words. You can also optionally filter the displayed results by variable, scenario and region.
-
Area: Open menu now shows 5 most recently used areas at the top of the list. The rest of the list is now correctly ordered alphabetically.
-
Added various new functions to expressions: Random, RandomUpper, RandomLowerUpper, TrueRandom, TrueRandomUpper, TrueRandomLowerUpper, RandomInteger, RandomIntegerUpper, RandomIntegerLowerUpper and BaselineValueIn(year). The TrueRandom functions return a truly random value while the Random function return a pseudo random value - it is random but repeatable for a given branch, scenario, region, variable and year. The BaselineValueIn(year) function returns the baseline value of the current branch/variable in a specified year: useful in Interp functions when creating mitigation scenarios. See the updated help file for more information on these new functions.
-
Improved LEAP's online registration process, which was confusing new LEAP users. You can now enter either your COMMEND password OR your LEAP registration code when you first run LEAP.
2008.063: 7/23/2009
-
LEAP was improperly checking activity level shares on technology branches for aggregate energy intensity methods. This caused an error message that halted calculations even if input data was OK.
-
Improved handling of expressions. Variable references or percentage values embedded in time series functions such as Interp or Step functions were not being properly processed.
-
Code completion was not working for variable references embedded in functions.
2008.059: 6/3/2009
-
Improved tabular display of results with the ability to add additional rows and columns that report various statistics including the total, minimum, maximum, mean, standard deviation, variance and (for tables with years as columns) annual average growth rates. Look for these options in a new "Statistics" button in the toolbar attached to tables in the Analysis and Results Views.
-
Improvements to API to better support manipulation of energy balance reports.
-
Improved CSV export format to properly remove extra commas in large numbers.
2008.058: 5/19/2009
-
Added better error checking to catch when historical production data is negative.
-
Made scaling factor selection "sticky" in energy balance reports.
2008.057: 5/17/2009
-
Added ability to specify environmental loadings per unit of added capacity and to directly input total annual environmental loadings in the demand and Transformation environmental loadings screens.
-
Further minor changes to better support large data sets.
2008.056: 5/14/2009
-
".LEAP" Files Make Sharing Data Easier: In addition to saving areas as ".zip" files LEAP now also uses and registers the ".leap" file type. You can backup an area to a single ".leap" file or send it to a colleague via email. The area can then be opened by double-clicking the ".leap" file. LEAP will either automatically open and install the area, or if LEAP is already open it will install and open the new file. If an area already exists of the same name, LEAP will offer to replace the area with the new one, whilst warning you if you are replacing a newer area with an older one. LEAP also still works with areas archived as standard ".zip" files.
-
Integration with COMMEND Web Site: LEAP is now integrated with the COMMEND web site so that users can optionally sign-in to LEAP using their COMMEND email address and password. If you have already applied for and been granted a LEAP license, LEAP will automatically download your license when you sign in, so there is no longer a need to remember the separate LEAP user name and registration code (although that option also still works).
-
Improved General: Units screen. Added ability to change number of decimal places, to show conversion factors in scientific or decimal formats, to export factors to Excel, to show all units together, and to sort the table by type, name or abbreviation.
-
Better Support for Large Data Sets. Typically most LEAP areas will have an unzipped size of a few megabytes. For example Freedonia is about 3 MB. However this update now supports areas many Gigabytes in size.
-
Improved Checking for Updates. Includes a button linking user to the web site so they can see what is new before installing the latest update.
-
New Unit Convertor dialog that stays on top of other Windows to help develop data for entry into LEAP.
-
Improved speed and reliability of reordering branches using the move up/down buttons or via drag and drop, particularly in multi-region areas where some branches are hidden.
-
Added ability to show tables in the Analysis, Results and Energy Balance views in Scientific format.
-
Reorganized the Area: Open option. The "Browse" and "Open from Internet" options have now been moved to a separate "Install" option under the Area: Open menu and have been renamed "Install from file" and "Install from Internet".
2008.054: 4/22/2009
- Improved code for detecting when LEAP data has been changed, resulting in fewer unnecessary and time consuming calculations (Thanks for beta testing Nan!).
- Improved code to reduce various memory leaks, resulting in better reliability and lower memory use.
- Added ability to export charts to the online Google Chart format.
- Added ability to email data sets to another person without erasing results.
2008.049: 4/10/2009
-
Added improved pie chart views into Results view. These now work much more intuitively, showing multiple pies on screen, listing pie slice names in the chart legend and with each pie properly labeled. You can also optionally have the area of each pie set to be proportional to the total pie value. See example here: http://tinyurl.com/c6uctx
2008.048: 4/3/2009
-
Improved display and conversion of units for resource and resource cost variables.
-
Improved options for formatting charts including new options to rotate X axis labels, more flexibly format gridlines, display symbols on line charts and automatically apply patterned shading on bar and area charts with many series.
-
Reorganized chart toolbars for improved user interface clarity.
-
Added new screen with many new export options for sending charts and tables to various destinations including the clipboard, printer, PowerPoint, Word, email, and numerous file formats (BMP, WMF, JPG, GIF, PNG, PDF, WMF, EPS, XLS, CSV, TXT). This new screen also provides an accurate preview of charts before printing/exporting as well the ability to fine tune titles, subtitles, axis labels and the positioning of the chart's legend.
-
Fixed incorrect conversion factor for the cubic feet volume unit in the default data set.
2008.044: 2/25/2009
- Additional improvements to the Value function to allow an expression to reference a previous year's value within a single expression.
- Improved checking of parameters in time series functions: now checks for duplicate and improperly ordered year parameters.
- Improved checking of growth rate parameters: by default checks if growth rates exceed 50%. In the General: Basic Parameters: Calculations screen you can edit this value or disable checking entirely.
2008.043: 2/24/2009
- Improved the Value function to support the referencing of future year values in other variables
- Extended the "IF" function to support multiple pairs of tests and results. This avoids the need for complex paired IF functions and helps to reduce the complexity of expressions.
- Improved display of hints on multiline expressions.
2008.041: 2/5/2009
- New Korean language translation, kindly provided by Hoseok Kim of the Korean Environment Institute.
2008.040: 1/29/2009
- Improved transport stock turnover calculations so that future sales (in scenarios) can be entered as a function of past retirements.
- Improved importing from Excel: no longer rounds off values imported from Excel to just a few decimal places.
2008.037: 12/3/2008
- Added new AnnualGrowth function that calculates the year on year growth rate of another branch/variable.
2008.036: 11/22/2008
- Added new calculated variable for device retirements in stock turnover calculations.
- Added requirement to accept terms of use agreement in the LEAP installation program.
2008.035: 11/09/2008
- New function: Subtotal and new use of Total function.
2008.032: 10/21/2008
- Fixed a problem when charts were exported to PowerPoint or the
clipboard. Minimum value of vertical axis was not set correctly.
- Added a new chart type: an unfilled Area chart (without vertical lines).
2008.031: 10/20/2008
-
Charts: can now optionally display two marker labels and a dividing line indicating how time series are divided between historical (Current Accounts) data and scenario projections. These markers have default labels ("< Actual" and "Projected >"), which you can click if you wish to edit the label. The marker labels and divider are only displayed on charts with years as the X axis and in cases where the Current Accounts contains more than one year of data. You can also right-click on a chart to disable this feature.
-
Unmet Requirements: Added new Results report showing overall unmet requirements (i.e. unserved demands) remaining after all Transformation modules have been calculated. This corresponds to the "unmet requirements" row in the Energy Balance table. Note that each Transformation module may also report "unmet requirements". However, these module level values do not necessarily sum up to the overall unmet requirements, since one module may leave some requirements unmet, but these may subsequently be met by modules in later branches of the tree. For example, am area may contain more than one electric generation module each of which produces a fraction of the overall electricity requirements.
-
Cost of Unmet Requirements: This new variable allows you to specify a damage cost per unit of unserved energy requirements (see above). For example, it can be used to specify an economic cost of electricity blackouts, brownouts or other incidents of unserved energy demands. This cost need not be the same as the original production cost of the fuel. If specified, this cost also now forms part of LEAP's overall social cost-benefit calculations.
-
Usage Factor: Added this new variable for use in non-transport stock turnover models. This variable is a simple multiplicative factor (with a default value of one) that is applied to the average intensity of all devices of any vintage in each year of the calculation. This variable was added to allow users to distinguish between device technical specifications which depend on stock turnover and the usage of the device which is likely to depend more on socio-economic factors. For example, you might use this factor to simulate how average household heating and cooling usage increases year-on-year as incomes increase, independently of the introduction of new building efficiency standards, which can be modeled via the Marginal Final Energy Intensity variable.
-
Energy Balance: Added option to export energy balance to a .CSV file.
-
API: Added new API functions to allow adding of aggregate energy intensity and useful energy branches and for exporting results to .XLS files. Also added new API functions for getting and setting the units, columns and scenarios in energy balances, and for copying energy balances to the clipboard, and exporting them to .XLS and .CSV files.
-
Charts: Added four new chart color palettes.
2008.029: 9/18/2008
-
Code Completion in LEAP Expressions. A new "code completion" feature has been added to help you enter Branch/Variable references in LEAP's expressions. Typing a branch name followed by the "\" character will pop up the list of branches below the typed branch name. Entering a branch name followed by the ":" character will pop up the list of variables available at that branch. Finally, once a full branch and variable reference has been entered, typing a "[" character will popup the list of units (but not the scaling factors) available for that branch/variable. When using the popup, you can select an item by double-clicking or by pressing Enter. The item name will then be added to the expression, or you can press Escape to dismiss the popup. Each popup appears after a short pause to allow you to manually type the property name yourself. Thus, with the code completion feature you can quickly specify full variable references for a long branch such as "Demand\Household\Urban\Cooking\Electricity:Final Energy Intensity[GJ" without having to type each branch and variable name. Code completion works for full branch references that start with either the area name or one of the top level branch names (demand, transformation, etc.). It also completes branch names for branches immediately neighboring the current expression.
-
Code Completion in the API Script Editor: The API script editor now also supports code completion to help you to reference the various objects that form part of LEAP's API. When you type the name of a LEAP object in your script and press the period (".") character, a popup window shows all the various properties and methods associated with that object. For example, typing "LEAP" followed by a "." will popup the list of all properties and methods for the main LEAP object.
-
API script editor color coding: The API script editor has been improved with the addition of line numbering and color coding of scripts, making it easier to read and debug BASIC scripts. BASIC keywords are colored blue, numbers purple and comments green.
-
A new checkbox on the Calculation tab of the General: Basic Parameters screen lets you switch the code completion feature off and on.
2008.028: 9/10/2008
-
Add IPCC Tier 1 Emission Factors to All Branches: New menu option on the Tree menu uses a heuristic (guessing) algorithm to add emission factors to all relevant branches in an area where energy is consumed or produced. The algorithm makes uses of the sector branch names and device fuels to pick the correct set of IPCC tier 1 emission factors from the TED technology database. IPCC Tier 1 emission factors are intended to represent good default sets of emission factors appropriate for doing first-cut GHG emissions assessments in situations where more specific technical or regional data is unavailable. NB: this option only works well if you are using standard English sector names (households, industry, transport, etc.) and the default list of fuels. In situations where no relevant set of factors are available for a device (e.g. if the device uses electricity) then no factors will be added. Because this algorithm is subject to error you will be given a chance to review any changes before they are applied.
-
In addition to the above option which adds factors for all branches, LEAP also uses the same algorithm to guess a default TED technology when you add a single set of emission factors by linking to TED (by pressing the TED button on the right of the Environmental Loadings screen).
-
Set First Reserve Depletion Year: Added ability to specify the first year in which reserves are depleted. By default this is set to the base year. This can be useful if your consumption data includes past years of historical data (e.g. 1970-2005), but your reserves data is for some more recent year (e.g. 2005). in this case declines in the reserve due to future consumption will occur only from 2005 onwards. This new option has been added as a new variable "First Depletion Year" on the General: Basic Parameters: Years screen.
-
Improved API: various new objects and methods added. Also now added the ability to temporarily disable all controls in LEAP for speed and the ability to manipulate data (expressions) during a calculation. Refer to the help file for more information on the API.
2008.026: 8/30/2008
- Improved load curve calculation: now properly reports when load curve hours and percentage values are not in the proper order.
2008.025: 8/11/2008
-
Improved opening of zipped areas: made more robust so that LEAP will now open areas even if they are zipped with embedded folder names.
-
Improved parsing of expressions and improved handling of variables in the expression builder.
2008.023: 7/29/2008
-
Reduced calculation times: large data sets now calculate significantly faster, especially multi-regional areas and areas with multi-year Current Accounts data. In some cases, calculation times are 25% or less compared to the previous version.
-
Improved Application Programming Interface (API):
-
Environmental effects and user variables are now included as collections of API objects.
-
Added the ability to add and delete API objects including areas, effects, fuels, regions, user variables, scenarios and branches.
-
API help pages improved and updated.
-
- User Variables: Increased maximum number from 10 to 30.
2008.021: 7/6/2008
- Fixes to Time-Series Wizard to properly handle base year and historical values when editing scenarios.
- Better handling of unit references in expressions.
2008.020: 6/30/2008
- Added new radar chart type with lines rather than filled areas.
- Added ability to change LEAP Areas folder and temporary working folder from General: Basic Parameters screen.
- Various additions to the API to support working with useful energy data.
2008.019: 6/17/2008
- Update to Support New Email Server. The Area: Email feature no longer works on older versions of LEAP. If you need to email an area or submit an error report you will need to update to this latest version.
2008.018: 6/12/2008
-
Added new Greek language translation. Many thanks to Thanos Angelis-Dimakis for this!
-
Added ability to specify Transformation emissions per unit of energy lost in a process.
-
Fixed bug in Summaries View: Newly created summaries were lost when the Save button was pressed. Also fixed various bugs in the summaries view.
-
Added ability to change color palette in Summaries View.
-
Fixed calculation of "score" indicators. These were being scaled from 0-5 or 0-10. Should have been from 1-5 and 1-10.
-
Fixed referencing of module-level results variables such as peak load, load factor, reserve margin, etc. These were being calculated incorrectly and were also not being reported in the proper units.
-
Made Energy Balance and Diagram Views more robust so that problem data sets with extreme values no longer generate error messages.
-
Changed how the Save button works to better support external API calls to Save data.
2008.017: 3/27/2008
-
New partial translation into Thai. Many thanks to Bundit Limmeechokchai and his students for this!
-
Improved reporting of imports and exports in Results view for multi-region data sets. Now optionally shows imports/exports disaggregated by trade within and beyond the Area.
-
Improved energy balances for multi-region data sets. Imports and exports are now disaggregated to show trade within and beyond the area.
-
Added new resource import and resource export variables to better support specification of imports and exports for primary fuels.
-
New "Multi Region Example" data set illustrating use of the In-Area Import and In-Area Export variables. Use Area: Open: Open from Internet menu option to get this data set.
2008.014: 3/2/2008
- Improved drag and drop of LEAP branch/variable references in the Expression Builder. This operation will now cause the full variable reference including scale and units to be added to the edit box.
- Re-implemented the ability to access LEAP branches and variables in the popup dialog version of the Expression Builder. This functionality had been disabled in earlier versions of LEAP2008 due to an incompatibility with Windows Vista (now fixed).
2008.013: 2/23/2008
- Now includes an Indonesian language translation. Many thanks to Oetomo Tri Winarno for this! Some terms in LEAP are still not being properly translated into other languages. I am working on this. An Indonesian translation of the LEAP training exercises is also under development by Oetomo.
2008.012: 2/5/2008
- Ditto Capability: Added a "ditto" capability to the main analysis view data entry table. Pressing Ctrl-D will cause any field to be copied from the value in the prior record in the table: helping to speed repetitive data entry tasks. Works for expressions and for scale, unit and lifecycle fields.
2008.09: 1/14/2008
- Revised interface: a new flatter, simpler look for data entry tables
- Improved data visualization: In Analysis View, a ">" marker now indicates the current record, which is also highlighted in the summary charts and tables in the lower pane. Clicking on either the chart or the table causes the active record to change in the data entry table: so that all three views stay synchronized.
- Speed-up: added caching to speed-up access to indicator variables.
2008.07: 1/8/2008
- Improved charts: When hovering over a point or bar, the label and value associated with the bar is displayed in the status panel at the bottom of the screen. Works in the results, overview, energy balance and summaries views.
- Improved energy balance charts: adding ability to show year label as a background.
2008.06: 1/3/2008
- Added new API functions for adding, deleting and reordering branches (see help pages on API for more information).
- Added ability to reference non-greenhouse gas emission results in expressions and indicators.
2008.05: 12/28/2007
- Added support in time-series functions (Interp, Step, etc.) for values
marked as "unavailable". You can create an annual value and instead of
entering a numeric value, you can enter "na", "x", "u" or ".." (all without
the quotes) to mark it as an unavailable value. For example:
Interp(1990, 100, 1991, 110, 1992, u, 1993, 140). This feature is
most useful when importing time series values from a database. Handling of
bad parameters in time-series functions has also been improved.
- When changing a demand technology branch type from a standard activity analysis to a transport analysis, LEAP did not correctly create the required fuel branch.
- Conversely, when changing a transport technology branch to an activity branch, LEAP did not correctly remove the branches below. LEAP asks you to confirm before making this change.
- The space (" ") character was not working as a thousand separator even
though this is used in some countries.
- The color scheme in the main analysis view data entry table was hard to
read on windows 2000 and earlier PCs.
- Added error checking in calculations to check that shares sum to 100%
for stock shares, sales shares and device shares in Transport analyses. Also
added diagnostic messages that alert you when mileage numbers and fuel
economy numbers are zero.
- Make Version in the Manage Areas screen was not working. It
gave an access violation.
- Edits to the General: First Scenario Year variable were not being
properly saved (required editing twice). Also, reorganized the
General: Basic Parameters: Years screen for improved usability.
- Added various new fuel economy units such as MPG (for both US and UK
gallons), liters/100km, liters/km and km/liter for gasoline, diesel and
ethanol. Fixed problems in converting between these units. LEAP now allows
you to convert fuel economy values between any fuel economy unit.
Conversions are done on an energy basis. So for example a US MPG value can
be converted to a UK MPG. LEAP also now supports showing fuel economy
results in any fuel economy unit in Results view.
2008.04: 12/06/2007
- Added ability to reference Resource variables in indicators.
- Made charts the default tab in Results view (the split view took up too
much space).
- Vista and XP "look and feel" manifest file is now installed as a separate file (leap.exe.manifest) in the program folder. If you have problems with Vista you can simply rename this file and LEAP will return to the old Windows 2000 look.
2008.02: 10/24/2007
- Added ability to select "Checked Scenarios" in Analysis View.
2008.01: 10/23/2007
Introduction
LEAP2008 includes many new features. Changes have focused on extending the methodological capabilities without adding complexity for existing users, and at the same time improving the overall usability of the system. Before installing the new version, we recommend that you follow the normal good practice of backing up the LEAP program and your LEAP data sets. However, LEAP2008 is designed to be fully backwards compatible with earlier versions, and is able to open and update areas created in earlier versions of LEAP. All of the changes are designed to incrementally add capabilities without changing the results generated from existing analyses (see below). Note however that earlier versions of LEAP cannot open areas created in LEAP2008.
Methodological Improvements
- Inter-Regional Energy Trade: LEAP2008 includes new variables
and reorganized calculations to enable calculation of inter-regional
trade in energy resources. In multi-region data sets, import demand
requirements in one region can now be used to endogenously drive the
calculation of exports in other regions.
- Multi-fuel Devices in Transport Stock-Turnover Calculations: In LEAP transport stock-turnover modeling, you can now create vehicles
with multiple feedstock fuels (for examples, ethanol and gasoline). This
allows for examining of fuel-switching policies in vehicles
- Regional and Scenario Comparison Indicators: Two new
functions have been added that let you calculate a wide variety of
cross-region and cross-scenario comparisons indicators. These functions
can be used to normalize and then compare variables in numerous
different ways such as scoring; ranking; z-scores (standardization);
re-scaling; ratios to means, highs and lows; differences from means,
highs and lows, etc. The new indicator functions will normally be used
when creating the new Indicator variables (see below).
- Improved Referencing of Results: Referencing of results in
regular modeling expressions has been improved. Previously you could
reference the lagged value of a result at a given branch such as "total
final energy demand." This always returned the total value of that
result. You could not filter the result to show, for example, just the
demand for one fuel. This is now possible using a new filtering syntax
in results references as follows:
Branch:Variable[Scale Units, Dimension=Value]
For example, to return, total final electricity demand at the Demand branch in Millions of Gigajoules you would write:
Demand:Energy demand final units[Million GJ, Fuel=Electricity]
You can specify up to two filters on a result. Allowable dimensions are:
- Indicator Variables: In addition to this new
results-filtering syntax, you can now also create non-lagged references
to Results variables in a special Indicators section of the Tree. Unlike
other variables, Indicator variables are calculated after all other
results calculations are complete, so they can include references both
to regular data variables and non-lagged references to results. Note
however that other data variables cannot reference indicator variables.
Indicator variables can be used to calculate any type of additional
result variable, although the new Indicator functions (see above) will
be especially useful for creating normalized variables used to compare
scenarios and regions. Indicator variable can be displayed within the
standard Results view using any of the chart types, including the new
- New Electric Sector Load Curve Method: LEAP now provides
three alternative methods for describing electric system loads: The two
existing methods: (1) Load Duration Curve For Entire System and (2)
Seasonal/Time-of-Day Load Shape for Each Electric Demand Technology are
now complemented by a third hybrid approach (3) Seasonal/Time-of-Day
Load Shape for Entire System. This third method combines some of the
best features of the two existing methods. The new method allows you to
specify load shapes for an entire electric system and is thus much less
data intensive than method (2), but at the same time it allows you to
specify seasonal and time-of-day load shape information as in method
(1), which thus allows you to more accurately simulate different
seasonal availability characteristics and dispatch strategies for power
plants. When using this method you need to specify a Base Year and End
Year Load Shape for each Transformation module.
- Improved Energy Balance Reports: These can now optionally
show sub-sectoral totals as well as the standard sectoral totals. An
additional toolbar checkbox lets you toggle sectoral or subsectoral
- Transformation Decommissioning Costs: Transformation Costs
can now also include decommissioning costs, which can be important for
nuclear power options. These are entered in the same way as capital
costs, although these costs are incurred whenever capacity is eliminated
- Improved Simulation of Production Priorities: In previous versions of LEAP domestic requirements were always assumed to have priority over export demands in cases where production was unable to fully meet both demands. You can now control this assumption by assigning first priority to domestic requirements or to exports or by giving both equal priorities. This option is found on the Output Properties tab for Transformations Output branches.
Data Management, Reporting and Ease-of-Use Improvements
- Integrated Expression Builder with Check-as-you-Type Error
Checking: The Expression builder, a tool for creating your modeling
expressions now works in an easier-to-use format: integrated into the
main Analysis View as a tab in the lower right-hand part of the screen.
This format makes the tool available all the time, avoiding the need to
open and close a separate window. It includes a new toolbar that checks
your expressions in real time as you type, and also provides instant
context-sensitive documentation of the functions in your expressions as
you navigate from branch to branch in the tree. This new format also
supports creation of expressions by dragging-and-dropping branches from
the main tree. The previous pop-up Expression builder has been retained
for those with smaller screen resolutions.
- Expression Elaboration has been improved and moved to a new
tab in Analysis View. This tab shows two lists: the variables referenced
by the current expression and the variable which themselves reference
the current expression. Double-clicking on any item in these lists will
make the display jump to the listed branch/variable.
- Integrated Help: LEAP contains hundreds of pages of help
which have been significantly revised for this new version; yet few
users ever open the separate context-sensitive help window. To address
this, a new help tab has been added in Analysis View that gives
immediate access to the help system for whatever variable the user is
working on.
- Improved Charting: Charts have been improved in various ways.
Two new types have been added: radar (spider) charts and step charts.
Also, you can now click on series in either tables or charts to have
both simultaneously highlighted. Other new charting features include new
color palettes, a new “invert axis” button on the chart toolbar, and on
single year charts, the option to show the year printed in large letters
as a background image of the chart. Finally, a new advanced settings
option gives fine control over a huge number of chart settings.
- New "Split" Results View: A “Split” tab has been added and is
the new default in the Results View. This view shows both a chart of the
selected results and the matching table of values in a single
split-screen.
- Web-browser style Back and Forward buttons in Analysis
view to make it easy to step back to the previously visited
branch/variable.
Miscellaneous Improvements
-
Improved View Bar. When the view bar is hidden a mini view toolbar is now displayed under the tree.
-
Improved Compatibility with Windows Vista: Significant additional testing has been done on Windows Vista and various Vista-specific issues have been addressed such as display problems with the Expression Builder. A new Vista-aware installation tool has also been adopted.
-
Key Assumption results (as well as Indicators) can now be viewed in the Results View.
-
Improved Registration screens to give easy access to the LEAP web site licensing page.
-
Updated event scripting to reflect the new multi-region calculation algorithms.
-
Improved importing from older data sets. Code improvements to resolve problems opening some older data sets.
-
More Flexible User Variables: User variables can now be assigned to additional branch types including non-energy sector branches, and indicator branches.
-
Improved Editing of Units and Scaling Factors: In the past units and scaling factors could only be edited in Current Accounts. They can now be changed while editing any scenario. LEAP gives a one-time reminder that changes will affect all scenarios.
-
Improved Exporting of Results: Tables exported to Excel now contain additional header information for a more complete documentation of exported results. In addition tables can also now be exported to .CSV text files.
-
Updated and Improved Help: The help system has been updated and improved to reflect all of the new features in LEAP2008.
Changes in Algorithms
- All of the methodological changes are designed to incrementally add capabilities without changing the results generated from existing analyses. There is one exception to this. This change affects LEAP’s discounting algorithm. Previously, costs were always discounted to the monetary unit year. But in cases where the study base year lies after the monetary unit year this did not make sense. Now LEAP discounts to the monetary unit year unless the base year is after the monetary unit year, in which case it discounts to the base year. In most analyses these two years are one and the same, so this change will not affect results. Note also that the discounting year is also now listed in reports to make discounting more explicit and transparent.
LEAP 2006
2006.037: 2/14/2007
- Corresponding heat rate values now calculated and displayed in Analysis View when entering Transformation efficiencies (also efficiencies displayed when entering heat rate data).
- Improved code to check for invalid list, decimal and thousand separator symbols.
2006.035: 1/30/2007
- Pasting Numbers into LEAP: LEAP can now automatically paste a block of numbers as a standard time-series function (Step, Interp, etc.). This makes it much easier to get data out of Excel and other programs and into LEAP. For more information see the Help topic on Pasting Arrays of Numbers into LEAP..
2006.032: 1/17/2007
- Windows Vista: Reorganization of code and location of data files to make LEAP compatible with Windows Vista. By default, LEAP areas are now stored under the "My Documents\LEAP Areas" folder. In Windows Vista this is simply the "Documents\LEAP Areas" folder. Previously areas were stored under the "Program Files\LEAP" folder.
- Added new functions to LEAP's expressions including a "CumulativeValue"
function and a StepLookup function. The CumulativeValue function calculate
the cumulative value of a variable from the base year to the year
immedaitely before the current (calculation) year. The StepLookup function
lets you lookup the value of one dependent variable based on the value of
another dependent variable. It works similarly to the existing Lookup
function but uses a step function rather than interpolating between points
on a curve. The existing lookup functions has also been extended to better
support modeling of cost curve functions.
- Various minor changes:
- Areas using stock turnover calculations and with multiple historical Current Accounts years were not being calculated correctly. Also improved display of the "stock" variable to reduce confusion. LEAP only use the base year value of this variable. Stock in subsequent years is calculated through LEAP's stock turnover calculations.
- Expressions that referred to result variables were not calculating consistently. Also improved error checking to ensure that only lagged result variables can be referenced in expressions.
- Some menu options were disabled after the mouse hovered over them.
- Improvements to the Internet update option. Now uses a "wizard" to take you through updates and lets you opt out of downloading optional components such as the help file.
- Button layouts in dialogs have been standardized to improve usability.
2006.030: 12/18/2006
- Expression Handling Improved. Variable references in expressions now include the scaling factor and units of the referred-to variables. These are displayed in square brackets written immediately after the branch: variable reference, such as "Industry: Activity Level[Billion Dollars]". You can also edit the scaling factor and unit used in the expression and LEAP will return a value to the expression in the appropriate units. This change has been made to make variable references more intuitive and flexible and to remove ambiguity about unit conversion factors. Note: if you edit a unit in an expression, you must use a unit of the same class as the unit used in the referenced variable. For example, if the reference variable has a mass unit (e.g. kg) then you may edit the reference to use any mass unit (tonne, pound, etc.).
- Units: Revised and expanded list of units (mass, volume, energy and distance).
- References to this Variable. Added a new pop-up list to show the branches and variables that depend on any other particular branch and variable. This list appears as a menu item labeled "References to this Variable" under the "Expression" button attached to each expression field in Analysis View. Select one of the listed dependent items to go directly to that branch and variable.
- Improved Lookup function. Now supports 2, 3 or 4 pairs of
independent and dependent variables.
2006.028: 10/15/2006
- Optimization: LEAP now automatically checks and updates the "BDE" database engine configuration. For large data sets this will yield significantly faster LEAP calculations.
- New functions: Various new functions added to the expression handler...
- BaselineGrowth/AvgBaselineGrowth: Calculates the growth rate of a variable in a baseline scenario.
- ParentScenarioGrowth/AvgParentScenarioGrowth: Calculates the growth rate of a variable in the "parent" scenario of the current scenario.
-
Renamed functions: Some functions have been
renamed for better overall naming consistency. Your expressions will
automatically reflect these changes. No editing of expressions is
needed.
- HGrowth is now HistoricalGrowth
- BaselineScenario is now BaselineValue
- ParentScenario is now ParentScenarioValue
2006.027: 9/04/2006
- Added new function LaggedValue(BranchVarName, Years) to allow for referencing of values lagged by more than one year.
2006.026: 8/24/2006
- Improved checking of circular branch/variable references. This should reduce the chances of "stack overflow" errors, thereby improving reliability.
- Stricter checking of branch, fuel and effect names. LEAP now checks all branch names whenever opening or calculating an area. You may notice that some names change when opening older data sets. For example he characters "(", ")" and "-" will be changed to "[", "]", and " ". This change has been made to reduce potential errors when evaluating expressions.
- For stock turnover calculations, the number of year over which devices are vintaged is now a user-defined variable. Previously it was fixed at 25 years. You can edit this value on the General: Basic Parameters: Stocks screen.
2006.025: 8/6/2006
- LEAP has been made more robust in handling Excel spreadsheet references in expressions. For example, LEAP will now correctly recognize "AB12" as a cell reference. Earlier version required spreadsheet range references to include the sheet name. Error handling while getting data from Excel has also been improved.
- New function added "Excel(Excelfilename,
CellReference)" Allows any single value to be extracted from Excel.
See help page.
- New function added "GrowthFromYearXL(Excelfilename,
RangeName)". This allows variables to be projected directly using growth
rates stored in Excel.
- Improved Refresh key (F9) to allow refreshing of screen after an
open Excel spreadsheet has been edited and then saved. The Refresh option is
now available from the popup menu attached to each expression.
- When exported to Excel, table titles now note whether results are differences versus another scenario.
2006.023: 7/24/2006
- User-Defined Functions in Expressions. You can now create
your own user-defined functions that extend LEAP's expressions. Functions
are called using the
CALL
function and can be written in Visual Basic (VBScript). LEAP also
includes a functions editor for editing user-defined functions.
- Browse to Open Areas: A new menu option has been added on the
Area: Open menu to allow you to browse for and restore a zipped area stored
in any folder on your PC or on a network drive. Once selected the area will
be opened and added to the list of available areas in the Area: Open menu.
- Two Other New functions Added.
-
HGROWTHcalculates the historical annual average growth rate for the
current branch. Use this function to project values based on the annual
average growth rate in the historical data as specified in Current
Accounts. To do this, enter: Growth(HGrowth).
- VALUE(year) returns the historical value of the branch in some specified year.
- Time-Series Wizard Improved. A new button has been added that
opens Excel and previews the range selected in the time-series wizard. Error
handling in the wizard has also been improved.
- Foreign Exchange Cost Calculations. In addition to considering the total costs and benefits of energy scenarios it can often be important to consider how costs are split between domestic and foreign exchange costs. In many developing countries, where US dollars or other foreign exchange is in short supply, least-cost energy policies may not necessarily the best if they place undue strain on a nation's limited supplies of foreign exchange. Thus, LEAP now lets you optionally examine the foreign exchange fraction of all costs. Also added optional ability to NOT annualize Transformation capital costs.
- The View Bar is now temporarily disabled during save and calculation operations, to eliminate errors caused by inadvertently clicking buttons during saving or recalculating an area.
2006.021: 5/30/2006
- Overviews: You can now set the order in which charts and tables are displayed in the Overviews screen. Use the Up and Down buttons at the top of the screen to do this.
- The Overview Manager screen has also been reorganized for better management of Overviews. It includes functions for adding and deleting overviews, for adding and deleting favorites from a particular overview, and for reordering favorites within an Overview.
2006.018: 5/1/2006
- New Variable: Additions to reserves, under the Resources branch for fossil fuels. Allows the for additional finds of fossil resources after the base year.
2006.016: 4/18/2006
- Reserve Margin Calculations: In previous versions, LEAP
would endogenously add capacity to maintain a user-defined planning reserve
margin, which was set exogenously for each Transformation module. If
you set this value too low, the module would not be able to fully meet peak
power requirements. Conversely, if you set it too high then LEAP would build
more capacity than was actually required to meet the peak. Now you can opt
to have LEAP calculate and set the required planning reserve margin
endogenously so that it builds sufficient but not excessive capacity to meet
peak requirements. Required reserve margin is calculated based on the system
peak load, and the percent availability of the available power plants in the
system. You can enable endogenous reserve margin calculations through a
check box on the properties screen for each Transformation module.
LEAP also now reports additional Transformation results categories:- Power Requirements Not Dispatched (to indicate where processes were unable to fully meet the peak requirements).
- Required Reserve Margin: the reserve margin needed to fully meet peak requirements.
- Actual Reserve Margin. The actual reserve margin due to LEAP making capacity additions (previously reported as "reserve margin"). NB: since capacity additions are discrete ("lumpy"), the actual reserve margin will generally be greater than or equal to the actual reserve margin (assuming that endogenous capacity additions have been enabled).
- Results View: Data variables can now be accessed in the Results
View alongside results variables. In the "Show" selection box, an extra
category of variables is listed marked "Data variables". Data variables can
be accessed using all the reporting capabilities of the Results View
including the ability to store "favorite" charts and tables and make
collections of favorites in the Overviews view. A new selection
box lets you show results for branches below the current tree branch (the
previous behavior) or at the current branch only. This is useful when
you want to show values for a particular Transformation process or demand
device. So for example you could show energy demand results separately for
household, industry, services, agriculture, and transport sectors or show
the total at the Demand branch.
- Overviews: Overviews now include a table showing all the values in the Overviews charts. The chart and table views are accessed via tabs at the top of the screen. You can also customize an Overview to pick a consistent dimension for all X-axes and legends, thereby overriding the dimensions stored with each "favorite" chart. A button has been added to let you export all Overview charts to PowerPoint with a single click. Another button lets you apply a consistent color palette to all of the charts. Finally, labeling of Overviews and chart legends has been improved.
- Color palettes can now be applied to the diagram view.
- Markers showing values and labels can now be displayed in charts. A new option has been added to the chart toolbar for selecting markers in charts.
- Icons added to chart, table, notes and map tabs.
2006.05: 3/09/2006
- Regions screen improved. New buttons for checking All or No regions. New button for reordering regions alphabetically.
2006.01: 2/24/2006
- Application Programming Interface (API): LEAP can act as a standard "COM Automation Server," meaning that other programs can control LEAP directly: changing data values, calculating results, and exporting them to Excel or other applications. Currently, LEAP's API provides functions for getting information about data structures, for getting and setting data and for getting results values. For example, you could write a short script that could run LEAP calculations many times, each time with a different set of input assumptions. LEAP's results could then be output to Excel or processed in the script and used to drive subsequent LEAP calculations. In this way LEAP's basic accounting calculations could be coupled with other models such as goal-seeking or optimizing tools.
- Script Editing Tool: To help you use the new API, we have added a new script editor tool. This is used to edit, interactively debug and run scripts that automate LEAP. The script editor uses Microsoft's Windows Script technology which directly supports scripts written in both VBScript and JScript. A few sample scripts are included and we will be adding additional scripts in the coming months. We also encourage users to share any scripts they create with other users by posting them on the LEAP web forum.
- Event Handler: A new event handler allows you to specify scripts that can be run at various times before, during and after LEAP's calculations: doing additional calculations or performing additional processing of data or results.
- Analysis View: Now supports concurrently editing all scenarios and all regions. A new variable selection box has been added. This duplicates the function of the data tabs, which can now optionally be hidden to reduce screen clutter. Finally, the lower chart/table/notes pane can temporarily be hidden to make more space on screen, which is especially useful when editing all regions or all scenarios.
- Faster: On larger data sets, LEAP's calculation times are reduced by 30-40%.
- Improvements to Expression Handling: New functions for statistical analysis and time-series manipulation, and more flexibility for analyzing time-series data. In particular you can now store a time-series in one place (e.g. under Key Assumptions) using the Data function and then make references to it from other branches using alternative time-series function such as Interp, Step and LinForecast.
LEAP 2005
2005.036: 12/06/2005
- Code made more robust on restart after a crash.
- Various improvements for hiding/ordering tree branches in multi-region areas.
2005.035: 11/30/2005
- Added two new functions for use in expressions: FirstScenarioYear and InterpFSY. These functions provide better support for interpolating when using a first scenario year that is after the base year. See the help file for more information.
- Updated help and added new credits page, listing some of the people and organizations who have contributed to LEAP over the past 20 years.
2005.034: 11/19/2005
- New Transformation Results Category: Module Balance. This
new type of report summarizes the balance between the various energy
requirements and products of a module. Requirements and exports are shown as
negative values while outputs, imports, co-production and unmet requirements
are shown as positive values.
In most circumstances, the positive and negative values will exactly counter-balance each other. However, bear in mind that in cases where there is surplus production (e.g. when dispatching a process to its full capacity regardless of requirements or when producing co-products regardless of requirements) then the outputs (positive) will be greater than the requirements (negative). Note also that outputs + imports may be less than requirements. In this case a further category will appear showing "unmet requirements". Bear in mind that requirements that remain unmet in one module may ultimately be met by a module lower down in the tree.
This report can be a useful debugging report for understanding the behavior of a module. In particular, you may find it useful to show this report as a chart in two different arrangements: Fuel by Balance Category (for a given year) and Balance Category by Year (for one or all fuels)
2005.033: 10/19/2005
- Improved performance when accessing lagged results variables in expressions (This option is switched off by default in the General: Basic Parameters: Calculations screen).
2005.029: 10/06/2005
- Improved debugging: When editing expressions the Unknown Function Identifier message (which occurs when LEAP cannot identify some part of your expression as a function or variable) has been improved. The error message now reports which part of the expression it is unable to identify. This can be helpful if you have misspelled a function or variable name. For example. If you typed an expression "10+abcde" and "abcde" was not not a branch or variable name then the error will report Unknown Function Identifier: "abcde".
- Multi-line Expressions. In the Expression Builder you can now enter and edit multi-line expressions. This can be useful for complex expressions and for those that include logical "if" functions. In the main Analysis View data-entry grid, multi-line expressions are compressed to fit on a single line, and the line breaks are represented by the tilde "~" character. The line breaks are restored if you view the expression in the Expression Builder.
2005.028: 9/12/2005
-
Mapping of Results: This version includes the ability to display results on a GIS map in Results View for multi-region areas. GIS Mapping components must be downloaded and installed separately and are available from the LEAP web site. Click here for notes on using the new mapping features in LEAP.
-
Improved results reporting for Transformation input fuels. Reports can now be subdivided into feedstock and auxiliary fuel use.
2005.023: 7/22/2005
-
Better Support for Historical Data: In previous versions of LEAP, all scenarios were assumed to start in the year after the base year. However, in some cases you might want to specify a time-series of historical data in Current Accounts (e.g. using an Interp function) and then have the scenarios start in a later year. For example, imagine you have historical data for 1980-2000 and you then want the scenarios to run from 2001-2030. Specifying this was difficult in earlier versions of LEAP because the scenario expressions would be used to generate values for 1981-2030. (i.e. the scenario expressions would overrule the historical data).
-
A new variable called "First Scenario Year" has been added on the Years tab of the General: Basic Parameters screen. In the above example, the Base Year would be set to 1980, and you would set First Scenario Year to 2001. Now, when LEAP gets results for scenario years it uses the Current Accounts expressions for the years from the Base Year to the year before the First Scenario Year (1980-2000). It uses the Scenario expressions for the years from the First Scenario Year onwards (2001-2030). By default, First scenario year is set to the year after the base year, so existing data sets will work the same as before.
The display of charts and tables in Analysis View has also been improved to reflect this new approach. Now, if First Scenario Year is more than one year after the base year, the Analysis View/Current Accounts charts and tables will show time-series for all of the historical years (base year to first scenario year-1). If First Scenario Year is left set to the default value of Base Year+1 the charts and tables will display information for just the base year (as in previous versions of LEAP).
- Endogenous Capacity Variable Now Available in Current
Accounts: LEAP now also allows endogenous capacity expansion to occur in
historical years.
- Two new Transformation Results Added: Capacity
Additions and Capacity Retirements. These show the capacity added and
retired in any particular year. Previously you could only see the total
capacity existing in any year (which could sometimes hide simultaneous
additions and retirements).
- Cancel Calculations: A cancel button has been added to the calculation dialog, letting you escape from a calculation that is taking too long.
2005.022: 7/19/2005
- Some Transformation process variables renamed to reduce confusion...
- Max Capacity Factor is now renamed Max Availability
- Capacity Value is now renamed Capacity Credit.
2005.020: 6/20/2005
- Energy Balance Table: Can now be shown for one or all fuels (when columns set to years or regions).
- General: Basic Parameters: Calculations: Additional options for checking iterative calculations of systems with feedback flows
2005.011: 5/10/2005
- Seasonal/Time of Day Variations for Electric Loads: Different load shapes can now optionally be specified for each demand device so that the overall system load shape is endogenously calculated across all demands. The affect of demand side management policies on the overall load shape can then be explored in scenarios. The previous exogenously defined load curve has been retained but made more precise with additional data points (10 instead of 7). Two new supporting screens on the General menu let you edit the time slices into which each year is divided and also let you edit a library of load shapes that can be applied to each load.
- Dispatch Simulation: Electric sector dispatch simulation has been improved. Different processes within a single module can now have different dispatch rules. Previously, one rule was set for a whole module. This gives more flexibility in simulating dispatch. For example, wind and other renewables can now be dispatched by percentage fraction to meet a specified renewable portfolio standard, while other plants are dispatched by merit order. When using the endogenously calculated load curves, power plants can also be set to dispatch differently in different seasons. For example, a hydro plant could be set to operate as base load in a wet season and peak load in a dry season. Plant availability (the maximum capacity factor) and merit order can now both be varied between different dispatch periods. The General: Time Slices screen lets you specify how a year is divided into different time slices and dispatch periods.
- Better Historical Dispatch: Previously, historical dispatch of processes could only be specified for the base year. Now, historical dispatch can be used up to any future year. A new variable, "first simulation year", indicates when to stop using historical dispatch and to start using the dispatch rule. This year can be different for each different process.
- Reporting of Demand Loads and Power Dispatched: Demand loads and power plant dispatch can now both be reported in the Results View, showing how they vary across branches, years and season/time of day.
- New Chinese Translation (Draft): Many thanks to Zhou Nan at the Lawrence Berkeley Lab in California for creating this!
- Better Looking User Interface: New, better looking and more colorful icons have been used. However, they are similar to the old icons, so they should be immediately familiar to current users.
- Improved Results View: including easier selection of results categories and a slider control for animating results across different years.
- Improved Exporting to Excel: Now remembers selections and shows names of branches and variables for better context. Excel exports can also now be sent to a new worksheet (i.e. adds a tab to an existing workbook) or, as before, to a new workbook. Worksheet tabs are given default names reflecting the result or data exported. Exporting to Excel has also been greatly speeded up.
- New Tab Showing All Variables at a Branch: In the Analysis View, a new tab lets you edit all variables at one branch in a single table. This special tab is shown highlighted with a blue dot.
- Improved Memory Management: LEAP now takes up much less memory when running, especially for more complex data sets (apx 25-30 MB instead of 40-50 MB or more). It should now run comfortably on PCs with 64MB of memory.
- Automatic Versioning: LEAP now saves multiple versions of areas, in case you decide you want to go back to a previous version of your data. Backup versions of Areas are automatically created when the area is saved. You may also manually create a version from the Area: Make Version menu option with an optional comment. LEAP will never automatically delete a version with a comment. Treat these versions as milestones. For example, once you have finished entering the Current Accounts for an Area, you may create a version with the comment "Current Accounts complete." As another example, suppose you had just finished a study and written a paper, you might create a milestone version, with the comment "Data set corresponding to March 2005 paper." The Manage Areas screen has been updated with tools to let you manage backup versions.
- Statistical Differences and Stock Changes: These are no longer limited to the base year only. They can now be specified in any future year. They can also now be reported in the Results view.
- In multi-region data sets, you can now hide tree branches in regions. Hidden branches are not included in a region's calculations.
- Easier Data Sharing: You can now email an area directly from the main screen.
- Improved Navigation: A web-like "breadcrumb" toolbar shown in the Analysis, Results and Notes views shows you which branch is currently selected and lets you navigate to other branches without having to use the tree. This replaces the "back" and "forward" buttons used in the Analysis view in earlier versions.
- Copying/Cutting and Pasting of Tree Branches. This had previously required three special shortcut keys (ALT-C, ALT-X and ALT-V), but now uses the standard Windows keys (Ctrl-C, Ctrl-X and Ctrl-V).
- Demand and Transformation Properties Screens Simplified: to make adding branches easier. New icons have been introduced to highlight branches where different demand analysis methodologies (activity, stock and transport analyses) are used.
LEAP 2004
2004.040: 1/31/2005
- Analysis View: Import from Excel improved. When importing from spreadsheets containing data values in columns, LEAP will now by default only overwrite constant, INTERP and STEP function expressions. GROWTH, REMAINDER and other complex expressions will not be overwritten by default. This does not affect imports from spreadsheets that are used to directly enter or edit LEAP expressions. This change was made so that complex models can be better preserved when importing data from spreadsheets.
- Analysis View: Import from Excel improved: You can now optionally export a spreadsheet containing data values for all years in columns
- Analysis View: Importing from Excel. LEAP now tests for invalid spreadsheet cells during imports (e.g. cells showing the #REF or #ERROR messages). Attempting to import values from these cells will show an error message containing the invalid cell formula. This helps to debug data sets.
2004.037: 12/02/2004
- Export to Excel: The Excel export/import feature has been greatly improved. Previously, you could only export a single variable across a single region. You can now export all of the tree-related data across all branches, regions, scenarios and variables with just a few mouse clicks. In addition, exporting has been optimized and is now much faster. LEAP now creates an Excel spreadsheet and then "auto-filters" it to make the data much easier to review and edit. Importing from Excel has also been improved You can now import both expressions and also units and scaling factors that have been edited in Excel. This function is accessed through the Analysis menu in the Analysis View. For more information please see the online help for Export to Excel and Import from Excel. NB: the format of spreadsheets exported from Excel has changed. Existing spreadsheet templates will need to be edited before they can be imported into LEAP.
2004.036: 11/22/04
- Scenario Manager: This screen has been redesigned to make it
easier to check and uncheck the scenarios to be calculated. Checkboxes
are now shown on the scenario tree so you can immediately see which
scenarios results are to be displayed. Two additional buttons at the foot of
the screen let you quickly check All or None of the scenarios.
- Energy Flow Diagram: LEAP now includes a diagram showing the
energy flows through an area. The new Energy Flow Diagram is similar to the
Reference Energy System shown in the Diagram View. However, unlike that view
it shows energy flow quantities for any given scenario or year, making it a
much more useful view of results. Energy flows are displayed as colored
boxes, with the width of the box proportional to the annual flow of energy.
The Energy Flow Diagram is accessed as a tab on the Energy Balance View.
Somewhat similar to a standard energy balance table, the energy flow diagram (shown below) displays the flows of energy through an area from primary resources (indigenous production and imports), through each Transformation module, to final demand and exports. Typically, energy flows are displayed for each fuel or fuel grouping. Each fuel or fuel grouping is displayed as a column, while major resource, Transformation and final demand categories are displayed as rows. You can also use the flow diagram to display total energy flows for each region or year (summed across all fuels). Unlike a standard energy balance table, the diagram shows exports as a class of final demand, rather than as a class of primary production. The diagram also indicates outflows of energy from the area as empty boxes. Empty boxes are shown in 4 situations:
1. Where losses occur in a Transformation module (e.g. losses during electric generation or transmission and distribution).
2. Where a fuel is consumed as a feedstock or auxiliary fuel in a Transformation module (e.g. crude oil is consumed in an oil refining module).
3. Where a fuel is exported from the system.
4. Where a demand remains fully or partially unmet.
In the diagram, the boxes decrease in size from one module to the next (reading down) where one of the above situations occur, but increase in size in the following 2 situations:
1. Where a new fuel is produced as a result of a module operating (e.g. electricity is produced in an electric generation module).
2. Where a fuel is indigenously produced or imported into the system.
2004.035: 11/05/04
- The display order of Processes and Outputs in Transformation branches have been switched to better reflect how energy physically flows through a system from resources to demands (Outputs are now shown above processes).
- Charting behavior has been improved in the Results View. When selecting a new results category, charts now default to line or stacked bar charts depending on whether results categories are stackable.
2004.034: 09/23/04
- Allocation of Emissions Back to Demand branches: A new category of reports has been added in the Results View that shows you the global warming potential (GWP) of all energy sector emissions allocated back to Demand Branches. In this type of report emissions from sectors that generate secondary fuels such as electricity are allocated back to the demand-side branches in which electricity is finally consumed. Similarly, emissions from oil refining are allocated back to the demand-side branches where oil products are finally consumed. Transformation emissions are allocated to demands based on the fraction of the total final fuel consumption that occurs at each demand branch. GWP emissions that occur directly at demand branches are also included. This type of report can be useful for seeing the full lifecycle emissions of various demand sectors. This results category is, by definition, only available at demand branches. NB: this type of report is only available if you have checked "Allocate primary energy and Transformation emissions back to demands" in the General: Basic Parameters: Scope screen.
- Updates to Effect GWP values/Added new effects for gases with high GWPs: The effects database has been updated to reflect the latest IPCC recommended values. This was a long overdue change to reflect the latest IPCC scientific report (Climate Change 2001). LEAP also now has GWP factors for both a 100 year and a 500 year time horizon, and you can switch between these two sets of GWPs in the Results view. For example, methane has a 100 year GWP of 23, but a 500 year GWP of only 7. Finally, I have also added entries for the most important non-energy sector gases with high GWPs (SF6, CFCs, HCFCs and HFCs). These gases often need to be accounted for in climate inventories.
2004.033: 09/08/04
- French Translation: LEAP can now be used in French: The help file has not been translated. To switch languages, choose menu option Areas: Language. Thanks to Libasse Ba at ENDA-TM in Senegal for creating the translation!
- Energy Balance: The energy balance now works better in multi-regional data sets. When showing the balance for "all regions", imports are the sum of imports from beyond the area, exports are the sum of exports beyond the area, and indigenous production if the sum of indigenous production in each area plus the sum of net imports into each region from other regions within the area.
2004.032: 08/12/04
- Total energy consumption can now be shown directly in the Analysis view in chart or table format using a pull down menu while editing energy intensity or activity level data. Currently this only works while creating an activity level analysis. It does not work for a transport stock turnover analysis.
- Added new units for fuel economy variable in transport analysis (km/m3 for gasoline, CNG and LPG).
2004.031: 08/12/04
- Removed intermediate calculated variables from being displayed as tabs in Analysis view (e.g. total activity Level, stocks, sales) . Instead, those variables can now be selected from a selection box immediately above the chart/table in the Analysis View. All of the same variables can still be accessed but this change reduces the number of variable tabs and makes the user interface more consistent (i.e. the variable tabs now always show you where data can be edited).
2004.026: 08/08/04
- Major Update to Data File Structures: This new version of LEAP
uses a reorganized data file structure with far fewer files. The new
structure simplifies the source code, making it easier to maintain and
enhance. It also yields reduced calculation times. In most cases you should
see calculation time reductions of around 30-50%. LEAP remains
backwards-compatible with earlier versions. When you open an area, it will
automatically be updated to the new structure. However, because of the major
change to the data structure, I strongly suggest that you back up your areas
before using the new version.
- New Variable: “Mileage Correction Factor”: for use in Transport
stock turnover analyses. This factor can be useful if you wish to create a
model that examines driving rebound effects in which the miles driven in ALL
vehicles (not just new vehicles) are responsive to certain variables such as
the cost of gasoline. For backwards compatibility, this variable has a
default value of 1.0. See help file for more information. Also the variable
previously named “Fuel Economy Degradation Factor” has been renamed “Fuel
Economy Correction Factor”.
- Added Ability to Model “Internal” and “External” Imports and Exports
for Multi-Regional analyses: In multi-regional analyses you can specify
what percentage fraction of imports and exports are internal (within the
regions of the area) or external (beyond the area). Then, when viewing
results summed across all regions, you can see the net imports and exports
beyond the region by summing across the external import and export results
categories. This feature is only valid for multi-regional data sets.
- Improved CO2 Tracking for Non-Energy Use of Fossil Fuels: A new variable “Non Energy Fraction” has been added to final energy demand analyses. Use this to specify the fraction of a fuel that is consumed for non-energy purposes. For backwards compatibility, this fraction is set by default to 0%. Fuels consumed for non-energy purposes are not subject to the (combustion) emissions factors specified in the environmental loadings tab. Instead, CO2 emissions are calculated based on the fraction of the fuel used for non-energy purposes, the fuel's carbon content (%) and the fraction of the carbon that is permanently stored when the fuel is used for non-energy purposes (%). These last two variables are specified on the fuels screen. LEAP has default values for carbon storage for each fossil fuel, and you can edit these values to match the situation in your own area.
- Primary Energy Calculations Made Optional to Reduce Calculation Time:
The recently introduced feature that calculates the primary energy
requirements of or more demand branches has been made optional since it
significantly slows down calculations. By default, this calculation is now
switched off. You can switch it back on by going to the General: Basic
Parameters: Scope screen, and checking “Calculate Primary Energy
Allocations”.
- Results Reporting Every N Years: You can now opt to have results
written every N years (e.g. every 2, 5 or 10 years). This can greatly reduce
calculation time, especially in very long range analyses. By default LEAP
writes results every year, but you can set the value of N by going to the
General: Basic Parameters: Years screen. Note that some calculations such as
transportation stock turnover and tracking of fossil fuel reserves require
that results are reported every year.
- Updated and Improved Help: Help has been updated to reflect the
latest changes. Also, new pages of help have been added: one for each
category of results in the Results View. A new toolbar button has been added
to show those pages in the Results View.
- Improved Results View: LEAP now remembers settings when switching
between Results View and other views. This helps reduce clicking.
- Improved Main Toolbar: You can now open areas directly from a
button on the main toolbar.
- Added Toolbar in Analysis View: A new toolbar shows the full path
of the currently highlighted tree branch. This helps show where you are when
editing in the Analysis View.
- Improved Drag and Drop/Copy and Paste for Tree Branches:
These
features now also work for Transformation modules and processes. Previously
these features only worked for Demand branches.
- Fixed “Insufficient disk space” Bug: A bug in the Borland
Database Engine (BDE), which is the software used by LEAP to access data
files, could cause LEAP to report that your PC was out of disk space
whenever there was an exact multiple of 4.0 GB of free disk space. This bug
has been fixed for Windows NT/2000/XP systems. Unfortunately, there is
currently no fix available for older Windows 95/98/ME systems.
2004.023: 06/21/04
- Portuguese Translation: LEAP can now also be used in Portuguese. The help file has
not been translated. To switch languages, choose menu option Areas:
Language.
Thanks to Flavio Pinheiro in Brazil for creating the Portuguese translation!
2004.022: 05/30/04
- Spanish Translation: LEAP can now be used in Spanish and English. Most elements of the user-interface have been translated. Data items, such as user-editable tree branch names, fuel names, unit names and effect names are not translated since they can be edited by the user. The user guide is also currently being translated and will be available soon. The help file has not been translated. To switch LEAP into Spanish choose menu option Areas: Language: Spanish. You can switch between English and Spanish at any time. Thanks to Nicolas Di Sbroiavacca and the team at IDEE/Fundacion Bariloche in Argentina for creating the Spanish translation!
- Eliminated 250 character restriction on expression length. The maximum length of an expression is now approximately 32,000 characters.
- Improved Import in Analysis view. Now warns you if no expressions
are imported.
2004.020: 05/13/04
- Supply Calculations Improved: Primary energy requirements are now allocated back to demand-side branches so that you can see the primary energy implications of consumption levels. Under the "demand" category in Results view, in addition to "net final energy demand" you will now see an additional option "primary energy requirements". So for example, under "net final energy demand" you may see results for electricity consumed in a refrigerator. When you choose "primary energy requirements", you will see instead the feedstock fuels used to generate this amount of electricity, accounting for all generation, transmission and distribution losses. You will also see how this mix of fuels changes over time. Note that LEAP assumes that each final fuel gets a proportion of the average mix of supply side processes in each year. In other words it does not distinguish between demand side technologies that operate at on and off peak, perhaps with a different mix of supply side technologies.
2004.016: 04/15/04
- Transport Modeling Improved: A new "fuel economy degradation
factor" variable has been added. Fuel economy data can now be entered as
the theoretical "rated" value for new vehicles (which is how the data is
commonly published). LEAP then calculates the "on-road" fuel economy by
applying the degradation factor to the calculated stock average "rated" fuel
economy. Note that the degradation factor can change over time but is
applied uniformly across the total stock in each year. When upgrading
from older data sets, the fuel economy degradation factor is initially set to
a value of one, so it will have no effect on your calculations. If you don't
want to use this feature simply enter a fuel economy degradation factor of
one.
2004.015: 04/07/04
- Charts improved: the "patterns" button has been replaced with a new color palette button, that lets you choose among a variety of different chart color palettes. The palettes include one that is similar to the palette used in Microsoft Excel, and another that uses patterns that are suitable when printing in black and white. Also, a scrollbar has been added to chart legends with large numbers of items. Chart formatting options are now accessible via a toolbar "Chart" menu in both the Analysis view and Results view.
2004.005: 01/27/04
- Iterative calculations improved in Transformation. Production from later modules can now be used to meet requirements in earlier modules.
2004.001: 01/20/04
-
Multiple Regions: LEAP now allows you to specify multiple regions within an area. A region might be a country (for a multi-country analysis) or a different state or province within a country (for a national analysis). Regions are a specific data dimension, so you can enter data and models for each region and view results either for one region or summed across regions. Regions can also be grouped for reporting purposes. For example, if you create a global analysis, you can specify each country as a region and then specify regional groupings for Europe, North America, Africa, Latin America, Asia, etc. This new feature also allows expressions to be inherited from one region to another. For example, you might specify that region "South" inherits most of its technical data (emission factors, energy intensities, etc.) from region "North". You then only need to enter data for region South where it differs from region North. This can greatly simplify data entry and model management. Use of regions is optional. If your data set contains only one region (which is true of any data set created in older versions of LEAP), then the region dimension will not appear in the results or energy balance reporting views. Two new options on the General menu have been added to allow you to create and edit Regions and Region Groupings.
-
Translatable Version: The user interface of the new version of LEAP can now be translated into different languages.
- New fuels can now be created as copies (with a new name) of an
existing fuel. This option is available when creating a new fuel in the fuels
database screen.
LEAP 2003
2003.053: 11/01/03
-
Total Activity is now shown as an extra tab in the Analysis View for Demand activity level analyses. Total Activity shows the result of multiplying down each of the Activity Level branch chains. A simple example is shown below. This has been added to make it easier to immediately see the implications of the data you enter for Activity Levels.
-
Error Reporting Improved: Internet communication problems could sometimes cause the error reporting screen or other email features to lock-up the whole of LEAP. This part of the code has been changed to work in the background so that control almost immediately returns to LEAP, even before the email is sent.
2003.052: 10/12/03
-
Optimization: Links to excel spreadsheets are now cached on disk between LEAP sessions, so that Excel itself only has to be opened by LEAP if the spreadsheet has been edited. This greatly reduces calculation times for Areas with many links to Excel spreadsheets.
2003.047: 09/03/03
-
Reporting of Environmental Loadings: Environmental reports in Results view now have an extra dimension: fuels.
-
Data links to TED improved: in addition to copying data from TED for emission factors you can now establish links to the data in TED that will be updated whenever the data in TED is updated.
-
Automating LEAP: The latest version of LEAP includes an experimental new feature that lets you automate LEAP from any standard Windows programming language such as Visual Basic or Delphi (which LEAP itself is written in). LEAP can also be automated using most standard scripting languages such as Visual Basic for Applications, which is built into Word, Excel and other parts of Microsoft Office. The system is experimental and currently only supports a few commands, but if there is sufficient interest the number will be increased in the future. For more information, please see the LEAP Help files under topic: Automating LEAP.
-
Updating improved. The built-in update system has been changed to use a passive rather than an active FTP protocol. This make the system work for those using LEAP behind an Internet firewall.
2003.046: 08/27/03
-
Export to Excel improved. Export now has a new configuration screen, which allows you to set all of the export options. Two new options have been added. The first lets you either export all expressions, or not export inherited expressions. The second lets you export all branches for either the current scenario or for all scenarios.
-
Import to Excel improved. Blank expressions in Excel will now cause the corresponding LEAP expression to be cleared. This is particularly useful if you wish to reset large numbers of expressions to their inherited expressions.
2003.045: 08/05/03
-
Optimization: screen refresh speed improved when entering data and navigating the tree in the Analysis View.
2003.044: 07/29/03
-
Email Connectivity: Emailing no longer requires that you have an email client such as Outlook Express or Netscape installed and configured on your PC. Sending emails is now handled by LEAP on its own. It only requires that your computer has a live Internet connection.
-
Error logging and reporting: Errors can now optionally be sent to SEI-Boston to help resolve them. When an error occurs, if you have a live Internet connection, LEAP will give you the option of sending an email report to SEI-Boston along with your own message and a screen-capture showing what was happening in LEAP when the error occurred.
2003.042: 06/30/03
-
Charts: added ability to show line charts with X axis cutting the Y axis at the minimum value (instead of only at zero).
-
Excel Links: When linking to live Excel spreadsheets, LEAP now automatically refreshes Analysis view data if Excel has been edited, and also automatically recalculates LEAP before showing results, even if no expressions have been edited.
2003.033: 06/11/03
- Moved the "What's New" page out of the Help file to reduce need for downloading updated help files.
2003.030: 05/20/03
- Splash-screen updated to match new design for LEAP web site.
- Links to Technical Support Forum updated to point to new forum.
- Optimization to improve speed of rendering fuel economy reports.
2003.029: 05/15/03
-
User Variables: In addition to the many variables defined by LEAP, you can now also create up to ten of your own User Variables. Once defined, each variable will appear as a new tab in the data entry screens of the Analysis View.
-
Smart Help Added to Expression Builder: The expression builder will now automatically show the help topic associated with the function highlighted in the edit box in the bottom part of the builder screen. As you click on a word in the edit box or move the edit cursor, the help topic displayed in the top half of the screen will automatically update.
-
New BaselineScenario & ParentScenario Functions: New functions have been added for use when constructing alternative policy scenarios in expressions. These let you refer to the value of a variable in the baseline or parent scenario, which is useful if you want to enter changes in values ("deltas") with respect to another scenario rather than having to enter absolute values.
-
New ExpInterp Function: A new function has been added that performs an exponential interpolation between specified data points. This function is similar to the Interp function that performs a linear interpolation, and takes the same parameters as that function.
-
Driver Variables category on the tree has been renamed. It is now called Key Variables. The old wording had caused some confusion to those doing transportation analyses!
-
Calculation Progress Dialog now displays calculation time in seconds and disables clicking on main form during calculation.
2003.026: 05/02/03
- New Results Variable: Average fuel economy can now be reported when using LEAP for Transportation analyses.
2003.024: 03/30/03
-
Calculations Improved: A new type of Transformation module has been added to deal with cases where you wish to have multiple independently dispatched processes, each of which has its own output fuel. To create this type of module, choose simple, un-dispatched module on the Transformation Module Properties screen. This type of module is useful when you want to represent transport losses in a number of different fuels. Previously, this had required a separate module for each fuel, which was cumbersome to create and made for quirky-looking energy balances. For this new type of module, the output fuels folder is not used. Instead, you pick the output fuel for each process on the efficiency or loss tab. The Transformation Module Properties screen has also been updated and redesigned to accommodate this change. For more information, see the new schematic diagrams of simple modules and standard modules.
-
Export to Excel/Import From Excel Improved. In addition to importing and exporting data and expressions, these now also import and export the scaling factor and units associated with most variables. This can be useful if you wish to change the scale or units of many branches at the same time (e.g. if changing the currency unit for a whole study). All you need to do is (1) export a variable from LEAP to Excel, (2) change the units by copying and pasting ranges of cells in Excel, then (3) re-import the spreadsheet.
-
Charts and Tables Enhanced. When branch names are displayed in charts and tables, they will now be shown in the same order as they are listed on the Tree. Previously, branches were ordered alphabetically. Tip: you can use the Up and Down buttons on the tree toolbar to set the order of branches. In addition charts now split long axis labels into two or more lines of text.
-
Sort Branches: A new option has been added to the Tree menu and pop-up, which lets you automatically sort branches alphabetically.
-
Technical Support Group: added a new menu option in LEAP to allow users to automatically register for the free LEAP Technical Support Group.
2003.021: 03/18/03
-
Calculations: LEAP no longer forces you to recalculate results after all edits to data. It still tells you when results need to be recalculated to ensure that results are up-to-date, but it now gives you the option of avoiding calculations and seeing previously-calculated results instead. Use this feature with care: previously calculated results may not reflect the latest edits to data.
2003.020: 02/28/03
-
References Improved. References can now be imported from Excel. Requires a currently active spreadsheet with one reference per row and minimally labeled "Year", "Author", "Title" and "Publisher" columns. Each record must be unique with respect to its year and author.
2003.019: 02/25/03
-
Installation Software Changed. Recent changes to LEAP caused problems when installing on older Windows 98 PCs, which in turn have prompted us to adopt a newer version of the InstallShield installation program. The latest version uses the standard Windows Installer, which should make installations more reliable. It also checks the target PC to ensure it has the required operating system (Windows 98 or later) and RAM before installation begins, and can also be used to repair LEAP installations.
-
New Result Variable: Transformation/Unmet Requirements. Shows any requirements that remain unmet after the dispatch of a module. Note that subsequently dispatched modules or, ultimately, imports may meet these unmet requirements.
-
Energy Balance Improved to show any fuel requirements that remain unmet after dispatch of all Transformation modules and after resource dispatch. This information appears as an extra row at the bottom of the balance table.
-
Handling of Unmet Requirements Improved: Previously any unmet requirements for secondary fuels after the dispatch of all modules could be simulated in only two ways: either (1) assuming that imports were available to meet those requirements, or (2) by adding those unmet requirements to demand and iterating the Transformation calculations to simulate systems with energy flow feedbacks. This has now been changed to allow for an additional case (3) in which the requirements are simply left unmet. Use the Resource Properties screen to set the properties of each resource to one of these three settings.
-
Improvements to Summary Reports. Now handles reports in which all units are the same more elegantly and allows absolute as well as indexed charts.
2003.016: 02/10/03
-
Useful Energy Analysis for Combined Heat and Power (CHP). When conducting a useful energy demand analysis, technologies can now optionally be set to produce a co-product. For example, a demand for heat in buildings could be met through a combination of conventional furnaces as well as combined heat and power units that consume natural gas at one efficiency, while producing electricity at another efficiency. Use the Demand Branch Properties screen to specify the co-product. Note that only technologies created under a useful aggregate energy branch can have co-products. Reporting has also been improved to let users examine both net final energy demand (consumption minus co-production), gross final energy demand (final consumption only), and co-production only.
-
Internet Updates Improved: The Internet-based update feature has been completely revamped to improve its reliability and to reduce the size and time of downloads. Updates have been split into separate files that allow typical program update downloads to be reduced from about 5.3 MB to about 1.4 MB. In situations where only help files or data files need to be updated, the download size will be even smaller. Also, by splitting the update into separate files the new system should work better with frequently-dropped connections, all of which should make updating LEAP easier for those with slower modem-based Internet connections. In addition the updated files are now loaded on a faster server for improved speed. For those with an always-on Internet connection, LEAP will automatically check for and notify users of available updates periodically.
-
Note: because of the changes in the Update system, when first updating to version 2003.016 the download will be approximately 8 MB in size. Subsequent updates will be as small as 1.4 MB. If you do not wish to download such a large file, you can order a copy of LEAP on CD-ROM from the LEAP web site for a nominal charge.
-
Improved Interface: The interface has been updated to support Windows XP user interface conventions. This does not affect users of Windows 2000 and earlier operating systems. A new menu option (View: Themes) lets you switch between standard Windows XP and Office XP-style menus.
2003.001: 10/28/02
- Improved Environmental Modeling Capabilities: Emission factors can now be entered as expressions just like other variables. This has several key advantages:
- Emissions factors can now be dynamic (i.e. change over time and vary by scenario).
- You can directly add to, override or delete emission factors within LEAP, instead of simply linking en masse to the factors specified in TED. So for example, you might first link to the IPCC factors for greenhouse gases and then add your own country- or technology-specific factors for other air pollutants.
New Transport Modeling Capabilities: In addition to the standard activity level x energy intensity methodology, the new version introduces a new demand-modeling methodology for those doing transportation analysis. With this new methodology, energy consumption is calculated as the product of the number of vehicles, the annual average mileage (i.e. distance traveled) and fuel economy (e.g. liters/100 km or the inverse of miles/gallon). Base year stocks of vehicles are either entered directly, or are calculated from vehicle sales and a lifecycle profile describing survival rates as vehicles age. In scenarios, you enter projections for future sales of vehicles, and for future levels of fuel economy, vehicle mileage and environmental loadings of newly added vehicles. Other lifecycle profiles are used to describe how mileage, fuel economy and environmental loadings change as vehicles age. LEAP then calculates the stock average values for fuel economy, mileage and environmental loadings across all vintages and hence the total level of energy consumption and environmental loadings. Unlike the other demand modeling methods, which only allow emission factors to be specified per unit of energy consumed or produced (e.g., kg/TJ), the transport analysis methodology also optionally allows you to specify emission factors per unit of distance traveled (e.g. grammes/vehicle-mile). Finally, the new transport methodology also optionally allows you to specify how government and business fleets of vehicles get "rolled over" into the private vehicle stock after a set number of years. Fuel economy data can be entered in any unit including miles/gallon (US and UK versions) and liters/100 km. LEAP automatically converts from one unit to the other.
-
Supply Curve Modeling in Transformation: You can now use the Endogenous Capacity screen in conjunction with the new Maximum Built Capacity variable to specify a supply curve in which one process is built first (up to its maximum built capacity) and thereafter other processes are added. Typically, currently available and/or cheaper technologies will be built first. For example: you might have a number of different classes of wind resources each with ascending costs, and each with different amounts of resource available. You can specify each as a separate process in LEAP, then add them all to the endogenous capacity screen. All will have the same addition order, but will be arranged in ascending build order to reflect their increasing costs. Then in LEAP's calculations, the lowest cost resource will be built up to its maximum built capacity, followed later by the other increasingly costly technologies.
-
Improved Modeling of Marginal vs Average data in Transformation: Transformation modeling has been improved to allow you to optionally specify technical data (efficiencies, emission factors, maximum capacity factors) for new additions rather than as average across the whole stock of installed plants.
-
Stock-Turnover Modeling Capabilities: A third demand modeling methodology has also been added (superseding a similar approach in earlier versions of LEAP). In this Stock Analysis method, energy consumption is calculated by analyzing the current and projected future stocks of energy-using devices, and the annual energy intensity of each device, based on the equation: energy consumption = stock of devices x energy intensity per device. With this approach you specify the current stock of devices and the historical energy intensity and environmental loadings of newly added devices. In scenarios, you project future additions (sales) of devices and the energy intensity and environmental loadings associated with those newly added devices. LEAP then calculates the stock average energy intensity and environmental loadings across all vintages and hence, ultimately, the overall level of energy consumption and environmental loadings.
-
Scenario Templates: You can now create a "scenario template" to give easy access to the key parameters used in your scenarios. This template is used by LEAP to let you quickly review the key parameters of existing scenarios of quickly specify a new set of parameters for a new scenario. You can specify any number of key parameters in a scenario template as well as constraints on the maximum and minimum value of each parameter.
-
New Excel Import/Export Feature: Two new menu options allow you to import and export large amounts of data between LEAP and Excel. The export option exports all of the data describing a single variable for a given scenario across all branches of the tree into a standard format "template" spreadsheet in Excel . The expressions used in LEAP are converted into year by year values, each of which are placed into an Excel cell. The import option performs the reverse operation. It takes the data from an Excel "template" spreadsheet and generates interpolation or step expressions to match in a LEAP scenario.
-
Downloading Areas From The Internet: An extended Open Area option now allows those with an Internet connection to automatically download and open additional example data sets stored on SEI's FTP server. To use this feature, first make sure you have a live Internet connection, then select Area: Open and choose Download from Internet. LEAP will contact the SEI web site and obtain a list of available Areas, from which you can choose one to download. Downloading each data set will take a few minutes. We are in the process of creating a range of different examples, so this feature will give access to an increasing number of Areas over time.
-
Improved Reporting: In the Results view, charts and tables can now be displayed showing year-on-year differences in values, or indexed values normalized to Current Accounts values (base year=1). Percentage values can now be shown in both charts and tables. Results can also now be grouped to aggregate smaller value items. This can be useful when there are so many items that the chart legend would otherwise be too tall to fit on screen. Finally, multiple pollutants can now be displayed on screen simultaneously as indexed or growth rate values.
-
Improved Expressions: In previous versions of LEAP, expressions could include logical tests using logical functions (lessthan, greaterthan, and, not, etc.). However the nomenclature of these functions made them difficult to write and understand. For example to test if one value was less than another you had to write: LessThan(VariableOne, VariableTwo). The new version of LEAP now supports these tests using standard mathematical operators "<, <=, = , <>, >, >=". So you can now write VariableOne < VariableTwo. LEAP also supports use of the keywords AND, OR and NOT as standard operators. In addition, two new functions True and False have been added which return values one and zero respectively. These changes are intended to help you write simpler and more readable expressions. The older format of logical functions has been retained for backwards compatibility, with the exception of the OR, AND and NOT functions which have been renamed fnOr, fnAnd and fnNOT. These functions will automatically be renamed when opening older data sets.
-
Improved Printing of Tree and Expressions: the option to print expressions has been improved and merged with the option to print the tree structure. You can now print out the tree structure, including the branch icons and all expressions for either the current variable or for all variables for the current scenario. The new option will also display the units for each variable. The print preview gives the option of printing a report, exporting it to Excel or Word or the Windows clipboard or saving it to file in a variety of standard file formats (RTF, TXT, CSV, XLS).
-
Improved Summary Reports: Summaries reports can now be displayed as charts. Previously they could only be viewed as tables.
-
Improved Time-Series Wizard: The linear and exponential forecast methods now have the option to force the estimated regression through the known base year value. Two new corresponding functions have been introduced.
-
Improved Links to Excel: When linking your LEAP data to Excel, the specified Excel ranges can now be specified as either 2 columns x many rows or 2 rows x many columns. Previously the data had to be arranged as columns of data (years and values).
-
Branch Locking: The new lock button on the tree menu is used to lock or unlock a branch and optionally any branches below it. Once locked, a branch cannot be edited.
-
Calculations Optimized: Calculations are roughly three times faster than the previous version in spite of the new and more complex calculations.
-
Various User Interface Improvements:
-
Menu Change: A new "Analysis" menu has been added to reflect the new Excel Import and Excel Export functions, and to give easier access to the important Expression Builder and Time-Series Wizard options. These two options are now also accessible as buttons on Analysis View toolbar.
-
Demand Branch Properties screen has been reorganized to make it less confusing and to provide more guidance on the selection of different analysis methods.
-
Automatic Calculation: To make data entry more responsive, it is now possible to switch-off the automatic updating of charts and tables in Analysis View. To do this, select menu option: Analysis: Automatic Calculation. When automatic calculation is switched-off, you can press the F9 key to manually update charts and tables, or select menu option Analysis: Calculate Now.
-
Chart Legend Ordering: Charts showing branch names are now ordered in the same way as the branches in the tree. Previously, branches in charts were ordered alphabetically.
-
Scenario Manager: Scenarios can now be selected within the scenario manager. When exiting the scenario manager, the scenario selection in the analysis view will also change.
-
Data Entry Tables now use an indicator in the left hand column corresponding to the item on the tree that is highlighted, making it easier to understand the relationship between data shown in the grid and the tree.
-
Smarter Help in Expression Builder: The Expression Builder now shows a page of help for the first function used in an expression.
-
Reset to Inherited pop-up menu options makes it easier to reset an expression to the expression entered in the parent scenario (or Current Accounts).
-
Easier Reordering of Branches: two new buttons let you reorder branches, moving them up and down one branch at a time. Previously, reordering required dragging and dropping of branches.
-
Automatic Splitter Resizing: to maximize size of charts and tables in Analysis View.
LEAP 2000
LEAP2000 was the original Windows based version of LEAP. See screen below to get an idea of how LEAP has changed since this first version.
2000.076: 03/08/02
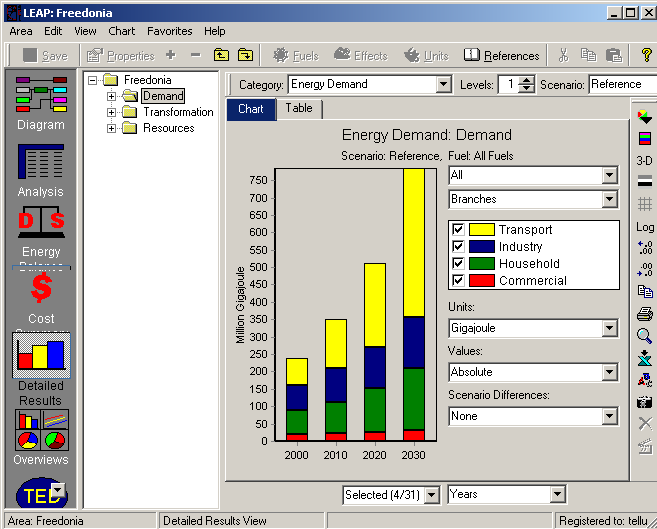
- Growth Function extended so it can now accept 4 or 5 different growth periods. Previously it was limited to a maximum of 3 periods.
2000.075: 03/04/02
- Fuels Database expanded to include additional fuels (methanol, CNG and propane). Data and notes also updated for ethanol and hydrogen.
2000.073: 02/19/02
- Improvements to Iterative Calculations: You can now customize the criteria for detecting convergence of Transformation Calculations on the General:Basic Parameters screen. Diagnostic messages for iterative calculations have also been improved to show scaled values.
- New Tip of the Day feature. LEAP will now optionally show you a short usage tip each time you start. You can then navigate backward and forward through other tips. In addition, you can get a tip at any time by selecting Help:Show Tip. Currently, there are about 50 tips.
2000.070: 02/12/02
- Password Protection: You can now specify a password to prevent an area from being opened and/or edited. Passwords can be added to existing areas using the Manage Areas option, or they can be specified when creating new areas. Areas that have edit protection can still be opened, but changes cannot be saved.
- Manage Areas Screen Redesigned to include additional information about areas including the user names of those who created the area and most recently saved data and the date when the area was last saved and last backed-up. In addition, the screen displays information on the password protection status of each area.
- New Log in option on the Area menu, can be used to log in to the current area. The option is only enabled for password-protected areas in cases where the user has not already entered the password.
- Diagnostics Improved: Because of LEAP's demand-driven calculations, the data specified in the Base Year Outputs tab, may not exactly equal the calculated outputs of a process. This can be due to problems in demand or transformation data. LEAP now generates a new warning diagnostic message whenever the data you enter differs from the calculated value by more than 2%. For more information on resolving such errors, refer to Base Year Outputs.
2000.065: 01/22/02
- Printing/Copying/Exporting of Charts to PowerPoint improved. A new Chart Options dialog box gives you the chance to review the text, fonts and visibility of a chart's title, subtitle, and axis labels, as well as the visibility and font of the legend. Scaling of charts has also been improved, leading to better looking chart printouts.
- New Find Fuels option on the Tree menu (Analysis View only) lets you search the branches of the Tree for all branches consuming or producing a selected fuel. The results are shown as a list of branch names, one of which can be clicked to jump directly to that branch in the main tree display.
2000.057: 01/11/02
- Improved Error Reporting: Following a failed calculation, LEAP now gives you the opportunity to view diagnostic messages that can help to identify problems. Previously, diagnostics were only available if calculations were successful. This can be especially useful when trying to identify why iterative calculations are not converging.
2000.054: 12/20/01
- Transformation Feedstock Fuels Reorganized. These now appear as separate branches under each process under a category labeled "feedstock fuels". Fuel shares can now be specified using expressions, which allows them to vary from year to year (NB: when a process has only one feedstock fuel this share should always be 100%). In previous versions, feedstock fuel shares were static variables specified on the process properties screen. Data entered in older versions of the software will automatically be converted to the new format. In addition, unlike in previous versions, you can now specify separate environmental loadings for each feedstock fuel.
- Auxiliary fuels can now be specified for Transformation processes. Auxiliary fuels are a useful of way of representing subsidiary or own-use energy consumption in a Transformation process, such as electricity used in an oil refinery or own-use of electricity in a power plant. Auxiliary fuel use is specified as energy consumed per unit of energy consumed or produced in a process. Unlike feedstock fuels, auxiliary fuels are not converted in a process, and hence their energy content is not included in how the overall energy efficiency of the process is calculated. For each auxiliary fuel you can also specify environmental effects, through links to the TED database.
- Energy Flow Feedbacks: To accommodate the more complex energy supply systems that can now be designed, Transformation calculations have been improved to allow for energy systems with energy flow feedbacks. For example, an oil refinery might produce diesel for use in power generation, while the oil refinery itself might consume some of the generated electricity.
2000.051: 12/10/01
- Results View interface improved to make it more intuitive, less cluttered and more compact. Selection of scale and units is now done by clicking buttons placed directly on the chart or table axes. Also, advanced options such as cumulative values and scenario differences have been placed on a separate toolbar that is only displayed when a "More..." button is clicked. These changes were made in response to feedback from some users who indicated that the number of options in this view was rather daunting.
- Denominator Variables in Results View. This allows additional reports to be created such as energy demand per dollar (of GDP), carbon emissions per capita, emissions per vehicle-mile, etc. To select a denominator, click on the denominator button on the chart or table axis, you will then be asked to choose a variable to use as the denominator. Typically, you will choose one of your Driver variables. To better support this feature, you can now specify scaling factors for key variables separately from their basic unit of measurement. You may wish to edit your key variables to reflect this change for better reporting. For example, if you have a GDP key variable with unit "billion dollars" you should change the unit to dollars and select "billion" for the scaling factor. Then, when showing a result denominated by GDP (e.g., emissions per unit of GDP), LEAP will show the results as emissions per dollar rather than per billion dollars.
- Links to Excel improved. Now allows Excel spreadsheets to be stored in area folder so that spreadsheets can be backed-up along with other LEAP data.
2000.043: 11/07/2001
- New Summaries View. A new summaries view supersedes (and includes) the old cost-benefit summary report. This new view lets you create and save any number of your own customized summary report tables. Each row of the table can be any combination of a tree branch and either a data or result variable. The columns of each report can be either years (for a given scenario) or scenarios (for a given year).
- Revised Demand Costing Methodology: A number of users had commented that the costing methodology in earlier versions was rather obscure. Costs of Saved Energy (CSE) had to be entered using a special expression and could not be seen on screen in the Analysis view. Demand costing has now been revised, making it more transparent and at the same time more flexible. CSE can now be entered directly without the need for a complex expression. A new screen display lets users pick the units and the baseline scenario against which a CSE value is to be measured. In addition, two new costing options have been added: (1) costs per device sold (based on the stock turnover data described above); and (2) total costs.
- Non-Energy Sector Effects: While its focus remains the energy sector, LEAP now optionally lets you create inventories and scenarios for non-energy related effects. Typically you can use this feature for including inventories and scenarios of non-energy sector greenhouse gas (GHG) emissions, as a complement to the analysis of energy sector greenhouse gas emissions and mitigation measures conducted in the other parts of LEAP.
- Lagged Results Variables in Expressions: Expressions in previous versions of LEAP could only reference the value of other data variables. You could not reference calculated results. So for example, electricity demand could be a function of an (exogenous) fuel price variable, but fuel price could not be a function of how much electricity is generated or what power plants are built. This new version introduces the ability to reference lagged result variables, giving you the ability to introduce these kinds of relationships.
- Printing of Charts/Tables etc.: a new printing system has been introduced for previewing and printing charts, tables, the RES diagram and the LEAP and TED tree structures.
- Export Reports to PowerPoint Slides: Charts, and the Diagram View can now be sent to a PowerPoint slide with a single click of a button.
- Improved Diagram View: The diagram view is now automatically sized to best fit the screen. It can also now be printed and exported to PowerPoint. Copying of the diagram to the Windows clipboard has also been improved.
2000.040: 8/30/2001
- Energy Demand in Primary or Final Equivalent Units: When displaying energy demand results, a new checkbox allows you to display fuels in either final or primary energy units. This has been added at the suggestion of researchers at the U.S. Lawrence Berkeley National Laboratory China Energy Group who suggest that electricity consumption should always be displayed in terms of the equivalent amount of primary energy required to produce it. When displaying in primary energy units, LEAP uses a special set of conversion efficiencies that can be edited in the Fuels database. These values do NOT automatically reflect the actual generation, transmission and distribution efficiency of your LEAP scenarios, so you may want to edit the default value to reflect the average efficiency in your Area.
- Insert Branches from Folder: This feature now requires you to map scenario and fuel lists created in separate sectors into a common overall set of scenarios/fuels. Now also optionally imports Key Variables data and properly updates branch references in expressions.
- Improved Handling of Errors in Expressions: When a branch referred to by an expression in another branch is deleted. The expression will now appear with the word "!ERROR!" in the expression (similar to how Excel handles references to deleted cells). Also, this error is now properly trapped and reported when calculating LEAP.
2000.037: 8/14/2001
- Parts of an Analysis can be Disabled to Reduce Calculation Time: Go to General: Basic Parameters: Scope to optionally disable Transformation & Resources, Stock Changes & Statistical Differences, Costs, and Environmental Loadings. Disabling an option does NOT delete any data, but simply hides the relevant data entry and reporting screens and reduces the scope of calculations. If you are initially concentrating on demand, disabling all these components will reduce calculation times by about 2/3.
2000.031: 7/5/2001
- Base year statistical differences and stock changes. New checkbox on basic parameters screen invokes use of base year stock changes and statistical differences. Each appears as a new top-level category in the tree, subdivided into primary and secondary fuels. Below that, one branch is shown for each fuel. List of fuels is automatically updated to reflect fuels used in your system. Results appear in the energy balance.
2000.027: 6/05/2001
- What's this? help added to main screen - makes it easier to get help on a particular part of the screen.
- New "Self-sufficiency" result variable showing percentage of resource requirements met by indigenously produced resources.
2000.026: 6/04/2001
- Multi-level results reports can now be grouped by name of bottom level - e.g. lets you see totals for cooking, heating, lighting, summed across multiple subsectors. Use the "levels" spin control in combination with the "Group branches" check box.
2000.023: 5/31/2001
- Improved Diagnostics: During calculations LEAP looks for common errors such as (a) whether all fuels in your demand analysis are produced by your Transformation analysis; (b) whether Transformation is producing fuels for which there are no requirements, (c) whether Transformation modules are incorrectly ordered (e.g. if Transmission & Distribution is placed below Electric Generation), and (d) whether Demand branches are not fully defined.
- Improved TED Data Entry: Environmental Effects can now be converted into other units on the Environmental Loading Factors screen (e.g. convert from kg/TJ of coal to lb/mmBTU of coal to kg/GWhr of electricity). For road vehicles also lets you convert from effects per unit of energy to effects per unit of distance traveled (e.g. from kg/liter to kg/veh-km).
- Improved Overviews: including new Overview Manager to simplify selection of "favorite" charts for display in Overviews.
- Resource Analysis: added new variable to reflect accessibility of biomass resources.
2000.020: 5/07/2001
- Chart series can now be clicked on and off using check boxes in the chart legend.
- Additional chart types: grouped bar and column charts.
- Improved energy balance charts now displayed as a single chart: refresh is now much faster and can now be copied to clipboard and printed.
- Favorites feature enhanced to make saving and updating of favorites easier (remembers last favorite name).
- Improved chart axis formatting to remove unwanted decimals, and to split long labels over 2 lines.
2000.015: 3/27/2001
- Calculation Speed: Now between 2 and 3 times faster (vs. 2000.014) - more when using larger number of scenarios.
2000.014: 3/16/2001
- Made more robust in cases where system closed down improperly. After improper close-down, LEAP now prompts you to select area to open.
2000.012: 02/26/2001
- What's New? help added. Shows what has changed in recent updates (i.e. displays this text file).
- Variable O&M costs can now be specified per unit of energy consumed or produced.
2000.09: 02/07/2001
- Energy units can be selected on energy intensity, and other energy denominated data charts.
- Energy balance can now be viewed with years as columns.
- Improvements to tables - now only shows row/column sums where appropriate, and allows copying to clipboard and selection of fonts.
2000.06: 01/24/2001
- First full release version.
LEAP 1995
LEAP v95.0 was the last DOS-based version of LEAP. It was a menu driven system that included separate closely linked programs for modeling energy demand (Demand), energy conversion (Transformation), Biomass, emissions calculations (Environment), cost-benefit calculation (Evaluation) and life cycle assessment (Fuel Chains). The screens shown here give an idea of how it worked.
Here also is the User Manual from a similar but slightly earlier (1992) version of LEAP.
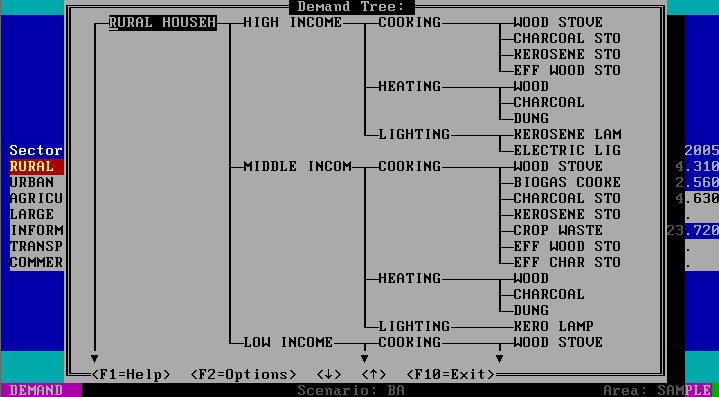
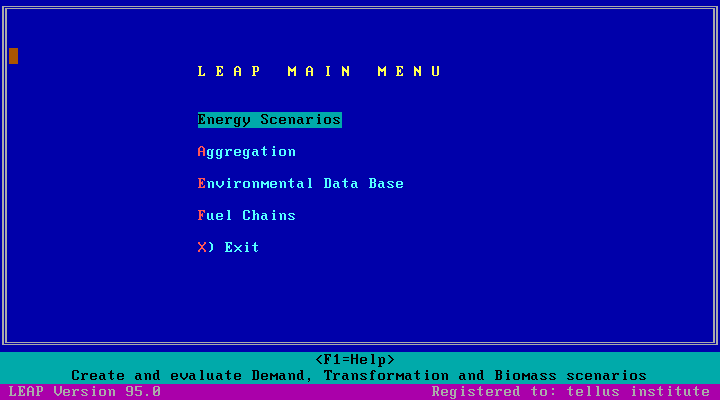
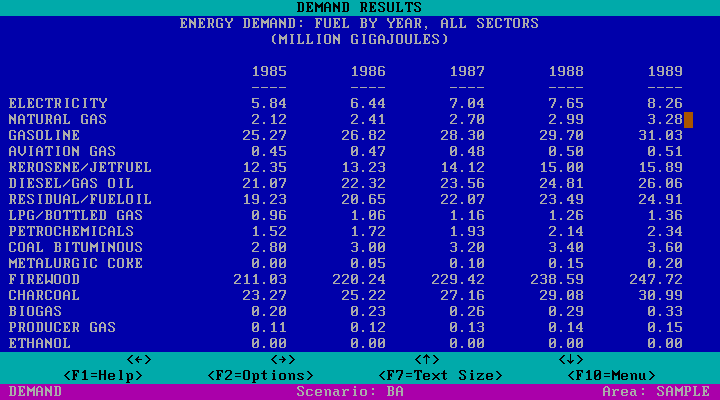
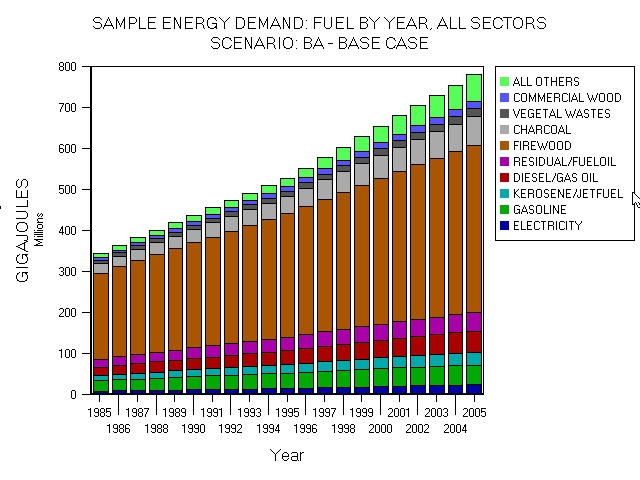
LEAP 1982-1986
The book "LEAP: A Description of the LDC Energy Alternatives Planning System", by Dr. Paul Raskin, was an overview of the first microcomputer version of LEAP. The book, published in 1986 and the first version of LEAP, resulted from the Beijer Institute's "Kenya Fuelwood Project", one of the first efforts to bring concepts of integrated energy planning to a developing country context, which ran from 1980 to 1982. Here are a few selected pages from the book that show how many of the basic concepts that you see in LEAP today originated in these early versions.