LEAP: Introduction

LEAP, the Low Emissions Analysis Platform, is a widely-used software tool for energy policy analysis and climate change mitigation assessment developed at the Stockholm Environment Institute.
LEAP has been adopted by thousands of organizations in more than 190 countries worldwide. Its users include government agencies, academics, non-governmental organizations, consulting companies, and energy utilities. It has been used at many different scales ranging from cities and states to national, regional and global applications.
LEAP is fast becoming the de facto standard for countries undertaking integrated resource planning, greenhouse gas (GHG) mitigation assessments, and Low Emission Development Strategies (LEDS) especially in the developing world, and many countries have also chosen to use LEAP as part of their commitment to report to the U.N. Framework Convention on Climate Change (UNFCCC). At least 32 countries used LEAP to create energy and emissions scenarios that were the basis for their Intended Nationally Determined Contributions on Climate Change (INDCs): the foundation of the historic Paris climate agreement intended to demonstrate the intent of countries to begin decarbonizing their economies and invest in climate-resilience.

LEAP is an integrated, scenario-based modeling tool that can be used to track energy consumption, production and resource extraction in all sectors of an economy. It can be used to account for both energy sector and non-energy sector greenhouse gas (GHG) emission sources and sinks. In addition to tracking GHGs, LEAP can also be used to analyze emissions of local and regional air pollutants, and short-lived climate pollutants (SLCPs) making it well-suited to studies of the climate co-benefits of local air pollution reduction.
LEAP has developed a reputation among its users for presenting complex energy analysis concepts in a transparent and intuitive way. At the same time, LEAP is flexible enough for users with a wide range of expertise: from leading global experts who wish to design polices and demonstrate their benefits to decision makers to trainers who want to build capacity among young analysts who are embarking on the challenge of understanding the complexity of energy systems.
LEAP is not a model of a particular energy system, but rather a tool that can be used to create models of different energy systems, where each requires its own unique data structures. LEAP supports a wide range of different modeling methodologies: on the demand side these range from bottom-up, end-use accounting techniques to top-down macroeconomic modeling. LEAP also includes a range of optional specialized methodologies including stock-turnover modeling for areas such as transport planning. On the supply side, LEAP provides a range of accounting, simulation and optimization methodologies that are powerful enough for modeling electric sector generation and capacity expansion planning, and which are also sufficiently flexible and transparent to allow LEAP to easily incorporate data and results from other more specialized models.
LEAP operates at two basic conceptual levels. At one level, LEAP's built-in calculations handle all of the "non controversial" energy, emissions and cost-benefit accounting calculations. At the second level, users enter spreadsheet-like expressions that can be used to specify time-varying data or to create a wide variety of sophisticated multi-variable models, thus enabling econometric and simulation approaches to be embedded within LEAP’s overall accounting framework. The newest versions of LEAP also support optimization modeling: allowing for the construction of least cost models of electric system capacity expansion and dispatch, potentially under various constraints such as limits of CO2 or local air pollution.
LEAP is intended as a medium- to long-term modeling tool. Most of its calculations occur on an annual time-step, and the time horizon can extend for an unlimited number of years. Studies typically include both a historical period known as the Current Accounts, in which the model is run to test its ability to replicate known statistical data, as well as multiple forward looking scenarios. Typically, most studies use a forecast period of between 20 and 50 years. Some results are calculated with a finer level of temporal detail. For example, for electric sector calculations the year can be split into different user-defined “time slices” to represent seasons, types of days or even representative times of the day. These slices can be used to examine how loads vary within the year and how electric power plants are dispatched differently in different seasons.

LEAP is designed around the concept of scenario analysis. Scenarios are self-consistent storylines of how an energy system might evolve over time. Using LEAP, policy analysts can create and then evaluate alternative scenarios by comparing their energy requirements, their social costs and benefits and their environmental impacts. The LEAP Scenario Manager, shown right, can be used to describe individual policy measures which can then be combined in different combinations and permutations into alternative integrated scenarios. This approach allows policy makers to assess the impact of an individual policy as well as the interactions that occur when multiple policies and measures are combined. For example, the benefits of appliance efficiency standards combined with a renewable portfolio standard might be less than the sum of the benefits of the two measures considered separately. In the screen shown right, individual measures are combined into an overall GHG Mitigation scenario containing various measures for reducing greenhouse gas emissions.
A key benefit of LEAP is its low initial data requirements. Many modeling tools rely on very particular and often quite complex solution algorithms such optimization, and so tend to have highly inflexible data requirements. Developing the data for such models is a time-consuming task, requiring relatively high levels of expertise. By contrast, because it provides a choice of modeling methodologies and many aspects of LEAP are optional, it therefore has much lower initial data requirements and allows its users to get started building models based on relatively simple accounting principles. LEAP’s adaptable and transparent data structures are well suited to an iterative analytical approach: one in which the user starts by rapidly creating an initial analysis that is as simple as possible. In later iterations the user adds complexity only where data is available and where the added detail provides further useful insights into the questions being addressed in the analysis.

LEAP is structured as a series of “views” of an energy system. The main “Analysis View” (shown here) is the place where users create data structures and scenarios and enter all of the data describing both historical years and forward-looking scenarios. In the Analysis View a hierarchical tree displays the main data structure for the analysis. The tree supports standard operations (copying, pasting, dragging and dropping, etc.) that simplify the construction and maintenance of data in an energy analysis. The tree affords a great deal of flexibility in how a system is modeled. For example a demand model might be highly disaggregated in a sector where a detailed technology-based analysis is required, but much more aggregate in sectors where energy use is less important or less well-understood. LEAP also supports multi-regional analyses in which different data structures can be created for each region. For example, some countries might be described in more detail where data are available or where important issues need to be addressed.

LEAP includes a number of built-in tools that make it easy to create complex models and projections. The time-series wizard lets you create interpolations, step functions and various trend forecasts either by entering data directly into LEAP or by importing data or creating a link to an Excel spreadsheet.
The Expression Builder lets you construct complex models that use LEAP’s large library of built-in functions as well as references to other data and results calculated within LEAP. Variable references can be constructed graphically by simply dragging and dropping branches from the main tree data structure into the Expression Builder tool. To help debug these models, the Expression Builder also provides check-as-you type validation of modeling expressions, displaying any syntax or run-time error messages on a toolbar in real-time.

Intuitive and easy-to-use reporting is another key ingredient of LEAP, helping users to visualize and interpret results and catch errors. LEAP calculates a huge set of results, which can be displayed as charts, tables and even maps. The Results View (shown below) makes working with multi-dimensional results very easy. For example, energy demand results are calculated across five dimensions: fuels, years, scenarios regions, and branches (i.e. the sectors and subsectors of the analysis). The user simply chooses the dimensions to display on each axis of the chart. For the other dimensions, the user can choose to display results for just one element or to sum results across all or selected elements. For example, the user might select demand results by fuel and by year for a particular region and a particular scenario for one sector (e.g. households).
Results can be displayed in almost any unit of measurement and numerous options are available for configuring results, including choice of type of chart (area, bar, line, pie, etc.), chart color, numeric format (absolute values, growth rates, percentage shares), number of decimals displayed in tables, etc). Alternative policy scenarios can be compared and evaluated by plotting multiple scenarios or by showing the differences in results versus a selected scenario. For example, you might compare costs for an active policy scenario versus a policy neutral business-as-usual scenario. All results can also be exported with a single mouse click: tables to Excel and charts to PowerPoint.
You can configure and save “favorite” charts in much the same way as you store bookmarks in a web browser: making it easy to quickly switch between key results for an analysis. Multiple favorite charts can even be grouped together and plotted on screen in the Overview view (shown below). Because results can easily and quickly be recalculated, LEAP can be used as a highly interactive debugging tool: one that encourages users to think critically about the validity and plausibility of analyses. LEAP’s training materials further reinforce the importance of these techniques.

LEAP has the ability to automatically generate results as standard format energy balance reports. These closely follow the standard format employed by the IEA and most national energy planning agencies. LEAP’s energy balances can be displayed in table, chart and sankey diagram format (see below) and they can be customized to summarize information for detailed or simplified fuel categories, for different years or for different regions. Energy balance results can also be shown by sector or by subsector in any energy unit.

Sankey diagrams can be used to visualize the energy balance flows for any area being modeled in LEAP. They give an overview of energy flows through a LEAP area from resources through each transformation module to energy demands. They include a representation of such details as imports, exports, stock changes, statistical differences and energy losses, and can be displayed for any year of any scenario. In multi-region areas you can show the Sankey diagram for the whole area or for any particular region. You can also zoom in on a Sankey Diagram to see the flows in a particular Transformation module such as Electric Generation or Oil Refining.

Analysts often need ready access to comprehensive and up-to-date data describing energy technologies. Such data are spread across a range of sources, which are not easily accessible, particularly to analysts in the developing countries. To address this problem, LEAP includes a Technology and Environmental Database (TED) that describes the technical characteristics, costs and environmental impacts of a range of energy technologies including existing technologies, current best practices and next generation devices.
TED includes data on hundreds of technologies, referencing reports by dozens of institutions including the Intergovernmental Panel on Climate Change (IPCC), the U.S. Department of Energy, and the International Energy Agency. In addition to its quantitative data, TED also includes qualitative information pages that review the availability, appropriateness, cost-effectiveness and key environmental issues for a wide range of energy technologies. TED’s own core database of emission factors can be edited or supplemented by a user’s own data. Emission factors and other information from TED can be automatically incorporated into LEAP analyses: making it easy to create emissions scenarios based on LEAP’s energy scenarios and the emission factors in TED.

However well designed an analysis, its usefulness will depend on how well it is documented and referenced. The Notes View in LEAP helps to address this problem, by providing a simple word processing tool with built-in bibliographic references database. The Notes view encourages users to document their data, assumptions and methods. Notes can be entered at each branch of the tree data structure, and subsequently printed or exported to Microsoft Word for use in reports.
The SEI Energy Modeling team has created a set of national level "starter" data sets for LEAP. These data sets compile international data together in a consistent manner as a starting point from which developing country analysts can subsequently develop their own more detailed analyses. They are designed to combine historical energy balance data provided by the the IEA with various other data sources such as emission factors from the IPCC, population projections from the United Nations, development indicators from the World Bank, non-energy sector GHG sources and sinks from the World Resources Institute and energy resource data from the World Energy Council.
LEAP and its associated training materials are already available in English, French, Spanish, Portuguese and Chinese with many additional translations currently under development by volunteers. A menu option within LEAP lets you immediately switch between any of its available language translations. LEAP also allows data to be input and to be displayed in any regional numeric format.

In addition to its use as a stand-alone modeling system, LEAP can also be integrated into a larger network of models using its standard Application Programming Interface (API). The API allows LEAP to be controlled using any standard object-oriented programming language, such as Visual Basic, C or Java. Programs can control how LEAP runs, insert and edit data, extract results or even programmatically alter data structures in LEAP. LEAP even includes its own built-in scripting tool, which you can user to create Visual Basic scripts that control LEAP.
In addition to its modeling capabilities, LEAP can now also be used as a tool for calculating, evaluating and displaying many social, economic, and energy-related development indicators. A range of functions are available that make it easy to create composite normalized indicators that compare results across regions or that evaluate the performance of alternative scenarios. A wide variety of indicators can be generated including 5 and 10 star scores, rankings and z-scores.
LEAP is a single-user system that operates on any standard PC using Windows Vista, Windows 7, Windows 8 or Windows 10. An Internet connection is not required, but is useful for online access to updates, technical support and additional data sets. Similarly, LEAP is designed to work closely with Microsoft Office applications such as Word, PowerPoint and Excel, although these are not required. LEAP is not designed to run on Apple or Linux computers.

LEAP includes extensive documentation and context-sensitive help. The help system, which contains over 300 pages of help, can be accessed from anywhere in the program using standard help keys or a point-and-click “What’s this?” help system. In addition, succinct “balloon help” messages are available for all on-screen elements (buttons, menu options and all variables). LEAP even includes a tip-of-the-day feature, which helps users to deepen their knowledge as they use LEAP.


LEAP’s design as a comprehensive decision support system, has allowed it to develop a reputation among its users for presenting complex energy analysis concepts in a transparent and intuitive way. "LEAP is the only substantial energy modeling software that is reasonably accessible to energy consultants who are not modeling specialists," says Mark Borchers, Director of Sustainable Energy Africa.
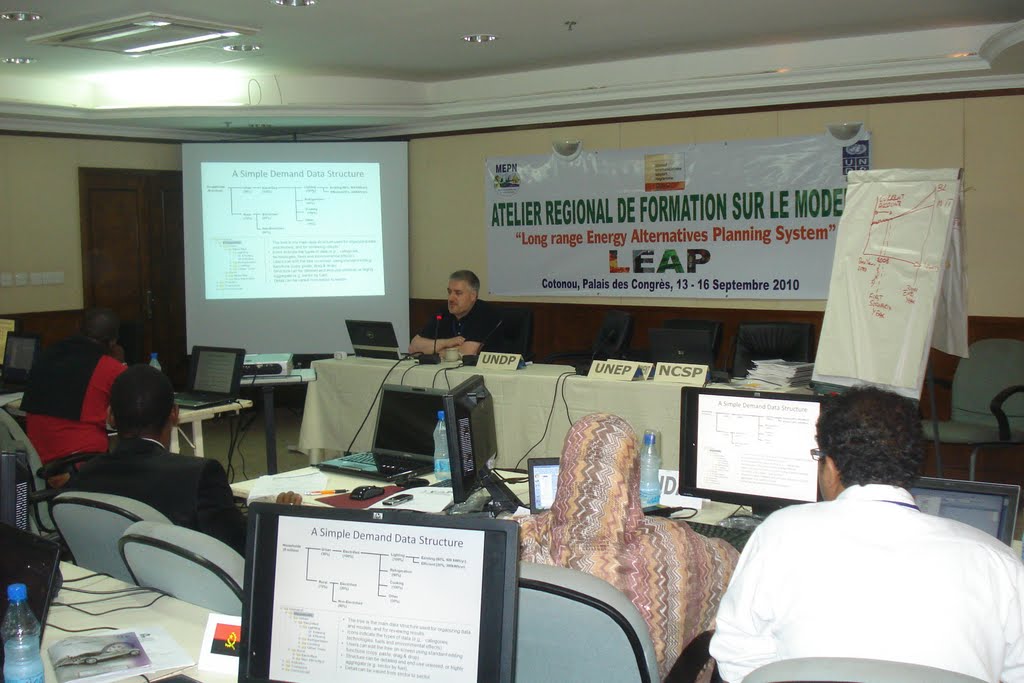
For over twenty years LEAP has been an important tool in the training and capacity building programmes of many national and international institutions in all major regions of the world. SEI has created a range of training materials designed to support these efforts. These have been translated into various languages and have been applied by SEI and its partners in a huge number of seminars and training workshops worldwide. The training materials are designed to draw out typical energy-environment policy dilemmas, and to encourage trainees to think about the tradeoffs inherent in different policy options.
LEAP and all of its associated training materials and documentation are distributed free of charge to academic, governmental and not-for-profit organizations based in the developing world. These training materials and user guides are available for download at the COMMEND website along with information on licensing arrangements for other types of organizations. A user name and password are required to fully enable LEAP. These are made available on completion of a license agreement, which all users are expected to sign.

The LEAP web site, is a web-based initiative designed to foster a community among developing country energy planners and to provide support to users of LEAP and other energy modeling tools. The site is open to all at no charge, and includes discussion forums where users can receive technical support from SEI and peer-to-peer support from other LEAP users. The site also has links to reference materials including descriptions of LEAP Applications, an online library of useful data sources and guidebooks for energy analysis.
While LEAP is designed to be as user-friendly as possible and is, we believe, significantly easier to use than other similar energy modeling tools, nevertheless it remains a relatively complex tool. Most users will therefore typically need training for about one week before they can use it effectively. Training is available through SEI and its regional partner organizations. We organize regular LEAP training workshops in various regions of the world. Please check the LEAP web site for news of these. Alternatively, please contact SEI to request a quotation for a training workshop for a particular country, economy or organization.
Click here for guidelines on how to properly cite LEAP in your published research.
For more information on LEAP, please contact SEI.