Topic: Remainder and Sum Functions Subscribe | Previous | Next
James Marett 2/2/2015
1138 Views Two early learning/growing pains:
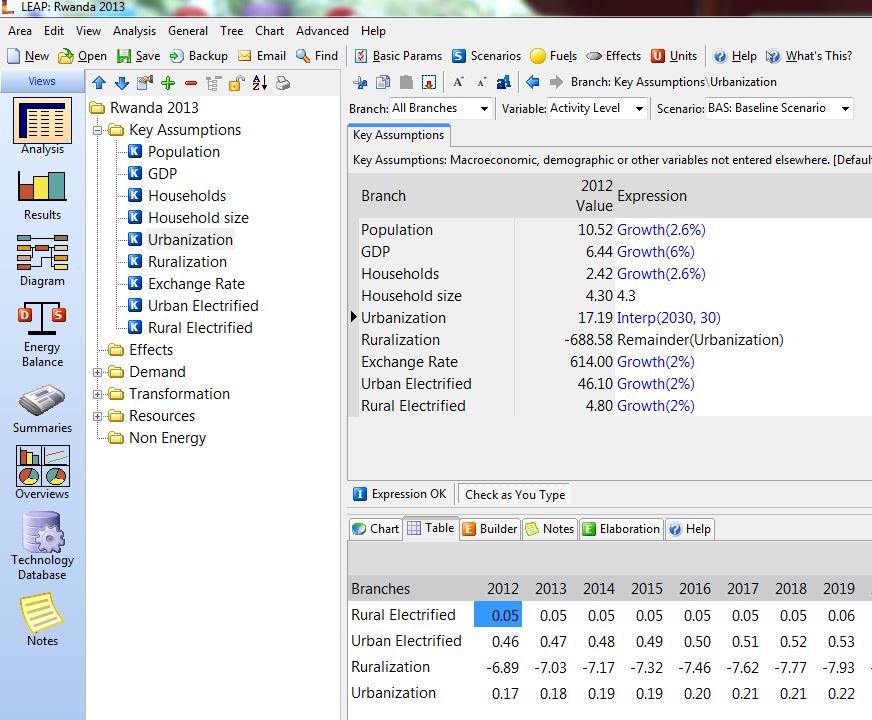
Question 1: I am trying to use remainder and sum functions in a vertical listing of 6 Key Assumptions of equal categories (same tree, no branches). I enter urbanization (17%). Then enter ruralization as "Remainder(urbanization)"...... I get squirreling numbers (-6.771%)
I also try Sum(1-urbanization) and program will not allow.
Question 2: (same screen) Why is chart/table display linking/deciding what variables to show. In this case it links all variables with "%" as activity level.
Does program use scale or units to decide what to show?
Example attached.
I see from Forum Search that remainder must be two adjacent branches. Is there an "end-around" that would allow keeping the urban/rural as Key Assumptions and still use remainder or another function?
Taylor Binnington 2/5/2015


1135 Views Hi James,
The Remainder function,
http://www.energycommunity.org/WebHelpPro/Expressions/Remainder.htm
...calculates the remainder of its argument after subtracting all sibling branches. There is no requirement on the number of sibling branches that must exist in order to use the function. I think for what you're trying to do, the correct expression to enter into your "Ruralization" Key Assumption would be:
100 - Urbanization
To your second question - LEAP displays all adjacent branches with the same units as the currently selected branch, when choosing which to display on the chart.
Take care,
Taylor