Topic: Cannot Import Hourly data from Excel sheet to Yearly Shapes (exercise:Optimization) Subscribe | Previous | Next
Popi Konidari 3/26/2015
1296 Views Hello!
At the 6th exercise on Optimization, when I click on the Import Hourly data (having opened the Excel file with the hourly data) and I fill in the screen with the indicated data (range, name), then the values that appear are not the same as the example. Actually, the first value (for Winter Day) is 100 and the others are zero.
I use past Excel version (.xls not .xlsx). Does this matter? I can't see the problem because I follow the exact guidelines of the exercise.
Also there is not any Optimization Example Partial in the options, so I use the version of Starting Point of Optimization Example.
Thank you in advance.
Taylor Binnington 3/26/2015


1295 Views Hi Popi,
This was a known issue until recently, and has been fixed as of version 2014.0.1.22. Please make sure you're running the latest version of LEAP by selecting Help: Check for Updates.
Best,
Taylor
Popi Konidari 3/27/2015
1291 Views Hello Taylor,
I am sure that I updated the program before doing the exercise. I tried it again and it is fixed for some reason. Now the problem is that I don't get any results or diagnostic messages after the running. I followed the exact insructions of the exercise. Could you please help me with this?
Thank you in advance.
Taylor Binnington 3/27/2015
1287 Views Hi Popi,
Please give me a little more information - for example, which results are not being displayed? Which part of our training exercises are you working on?
Taylor
Popi Konidari 3/30/2015
1268 Views Hello Taylor,
I am working on the Exercise 6: Optimization example, starting with the version: Starting Point of Optimization Exercise. I follow the instructions and when I get to the point 6.3.1 to click on the Results View, no results for any category are displayed.
Taylor Binnington 4/1/2015

1266 Views Hi Popi,
Just so I understand you: you are saying that you cannot view any results at all - no final energy demand, none of the transformation results, no cost results, no matter which branch of the tree you have selected. Is that correct?
Please confirm this before I make a suggestion about what to do. This would be most unusual - I would suggest that after saving your area, you open the 'Optimization Exercise' that comes pre-installed with LEAP, and select Area: Revert to Version: Complete, so that you can be sure you have entered all of the information correctly by comparison with the complete exercise.
That being said, in LEAP 2014.0.1.24 we are aware of an issue with capacity expansion, and are working to resolve it for the next version. However, you should still be able to view results for your area.
Best,
Taylor
Agnes Kelemen 4/18/2017

Hi Taylor,
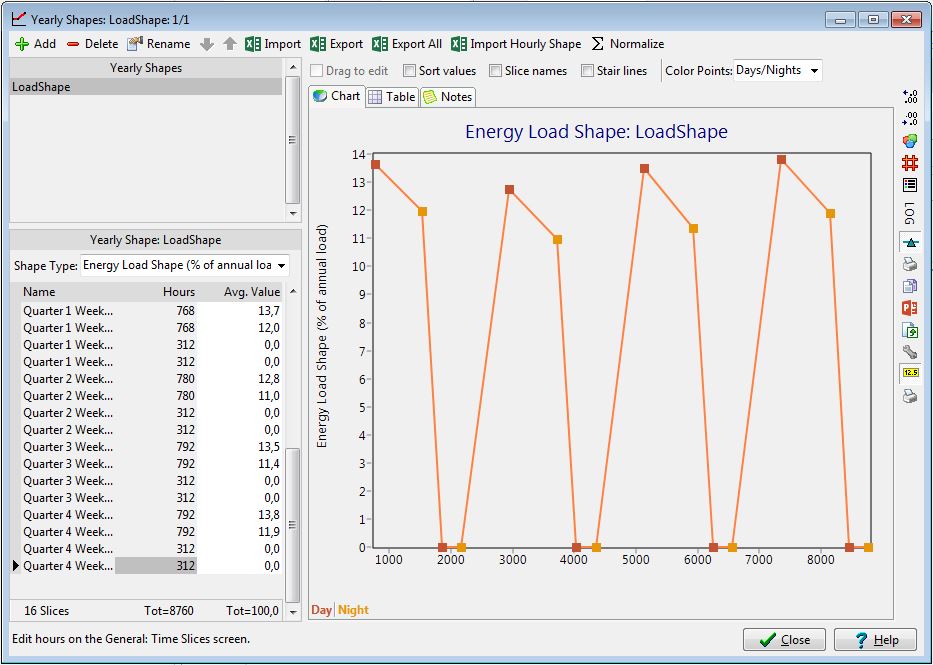
I am having similar issues, with data imported from excel and weekend day and night values showing up as zero in LEAP. There are no zero values in the excel file. I have attached a screenshot of what it looks like in LEAP. Do you have any idea of what could be wrong?
Thank you for your help!
Agnes
Taylor Binnington 4/19/2017
Hi Agnes,
Sorry for this trouble. I have a suspicion, but would like to test it before making a recommendation to you. Can you send me (to leap@sei-us.org) the Excel file which you are trying to import, as well as a complete description of the time slices in your model and step-by-step instructions for how you are importing the Excel data into your Yearly Shape?
Thanks very much,
Taylor
Agnes Kelemen 4/20/2017
Hi Taylor, I don't know how to delete a message from here, but have contacted Charlie and he is dealing with the issue for now, so please don't work on this unless he finds that he does not have time after all.
Hi Taylor,
I sent you an email but received a message saying it was not delivered. I sent the message below:
Attached is the Excel file. I imported data from the only named range in the file which shows hourly load as a percent of total annual load.
In the Basic Parameters I chose 'Load shape for each device'. I then set up the time slices using the detailed time slices option. I changed the time slices since I posted on the LEAP site from quarterly to monthly, but the other settings are the same, i.e. I chose the options 12 months, night and day, weekdays and weekends and grouping according to season. Then I went to set up the Yearly shapes, and simply imported the data from the excel file. The shape type is specified as 'energy load shape, % of annual load'.
Do you need me to send you the LEAP file as well?
In the meantime I have added some availability curves to some electricity technologies (wind, hydro, solar, and a combined cycle district heating plant which only produces electricity in the winter) and I had the same issue there. I used pretty much the same procedure, except I selected the availability shape, where I added data indicating hourly production as a percentage of capacity for 8760 hours. Here I also had some zero values for weekends which should not be zero.
Best,
Agnes
 HU_hourly_demand_ak.xlsx [5]