Topic: Import hourly shape to peak load shape giving zero load at times Subscribe | Previous | Next
Damon Lane 7/1/2015

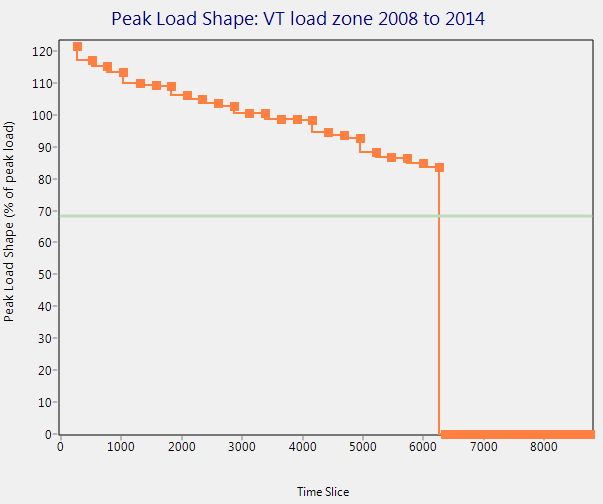
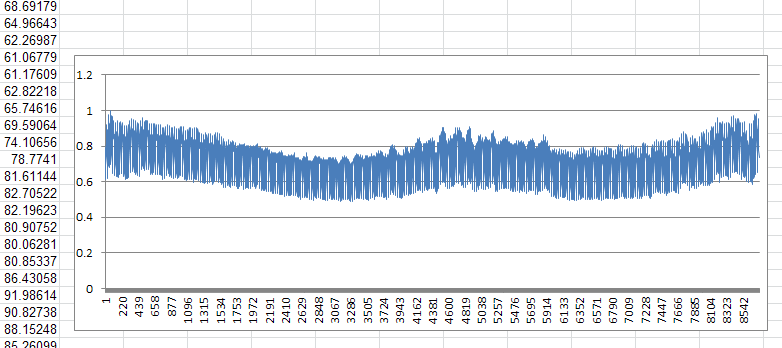
1081 Views Hello, I have 8760 load shape data and am trying to import it to the 48 time slices I'm using in LEAP. In Excel, I turned the MW numbers into % of max MW so the values now range between 48% and 100%, averaging 72%. When I use the import hourly shape function, I get a load shape that goes above 120%, spends about a quarter of the year at zero and averages about 68%. I know these graphs are sorted differently and won't look the same, but the duration curve in LEAP doesn't seem to correspond to the imported data. Am I misunderstanding something or is the tool not importing correctly?
Taylor Binnington 7/3/2015


1080 Views Hi Damon,
A few questions, first:
1) How are you trying to import the load shape? In the Yearly Shapes screen, are you using the built-in "Import Hourly Shape" feature, or the more basic "Import" feature?
2) Which version of LEAP are you currently running?
Note that within the last few versions, that have been some fixes to LEAP's handling of load shapes. Please make sure you are using the most recent version, which is currently 2014.0.1.29 (you can select Help: Check for Updates from the main menu to download it).
Also, it should not be necessary to first convert your hourly loads to percentages of peak load - LEAP will do this for you. When LEAP displays a chart of the imported Load Shape in the Yearly Shapes window, the default setting is to order the time slices from highest to lowest load. So although the import itself did not perform correctly for you, this may explain the difference in shape when compared to the curve as plotted in Excel.
Please let me know if the problem persists on the most recent version.
Take care,
Taylor
Damon Lane 7/6/2015

1064 Views Hi Taylor, thanks for helping with this.
1.) I'm using the "Import Hourly Shape" feature because it appears that it will convert my 8760 data to the time slices used in my LEAP model whereas the "Import" looks like I would have to have the data already in the time slices.
2.) Yes, I am using the latest version: 2014.0.1.29
I have tried pointing the import to the percent formatted like 0.55, formatted like 55, and now after reading your reply to the raw megawatt numbers. In each case I get the same results with zero load for the last ~2500 hours.
Taylor Binnington 7/6/2015
1063 Views Hi Damon,
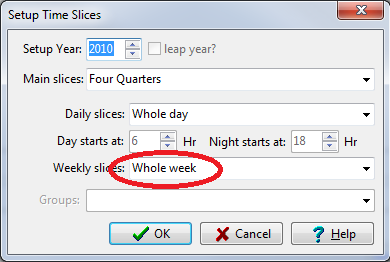
Thank you for pointing this out - I can reproduce it on my computer using time slices which differentiate between weekends and weekdays. In your model do you assign weekday hours and weekend hours to different time slices?
We'll try to resolve this issue in the next version of LEAP. In the meantime I suggest using only the "Whole Week" option while setting up your time slices.
Sorry for the inconvenience - we hope to address this shortly.
Taylor
Damon Lane 7/8/2015
1053 Views Thanks Taylor, the whole week works. I was using week/weekend. But now that we added regions to our model I am probably going to reduce the number of time slices anyway for calculation speed.
Damon Lane 5/18/2017
Hi Taylor, I can confirm this is still an issue in LEAP 2017.0.9. But finding this post also reminded me of the work-around, which should be fine for our latest project.
Taylor Binnington 5/18/2017