Topic: Regarding Import hourly data from Excel spreadsheet Subscribe | Previous | Next
Tri Ilham wicaksono 12/7/2016
Greetings,
As I knew, LEAP is able to import hourly shapes of load duration from General:Yearly Shapes. I have several questions :
1. What are the differences between Energy Load Shape (% of annual load) and Peak Load Shape (% of peak load) ?
I have read the explanations from these links
http://www.energycommunity.org/WebHelpPro/Transformation/System_Energy_Load_Shape.htm
http://www.energycommunity.org/WebHelpPro/Transformation/System_Peak_Load_Shape.htm
Unfortunately I still haven't understand the differences.
I want to do optimization with LEAP and activating "Optimize" feature,
So what's the best choice from both system load that i've mentioned above?
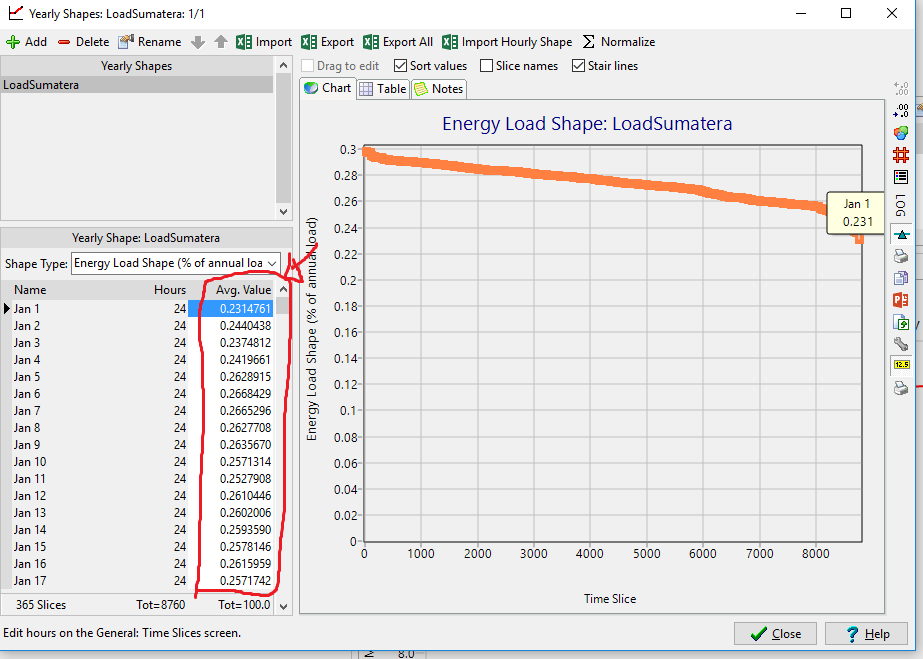
2. I've tried to use Energy Load Shape (% of annual load)
Timeslice 365x24, and I've made my data to follow the 365x24 form.
I've successfully imported from excel.
But i do not understand, what's the meaning of these number (see attachment) in Avg. Value column?
Because, the value is different from my input data (from Excel)
I expected to see the average value in percentage (%) form.
3. When we are importing load duration from Excel, in what unit do we have to input properly? in kWh or MWh?
Because in LEAP General:Yearly Shapes, there is no option or setting for adjusting input unit or scale.
Thank you so much for anybody who reply and answer my questions. I really appreciate it.
Best Regards,
Tri Ilham Wicaksono