Topic: LEAP 2017 Subscribe | Previous | Next

42 Likes
The new version of LEAP focuses on improved results visualization based on significant upgrades to the tagging capabilities. We have also worked hard on overall software quality with many bugs fixed, made possible in part by our new bug tracking system.
One of the key new features is the ability to use tags as a reporting dimension:
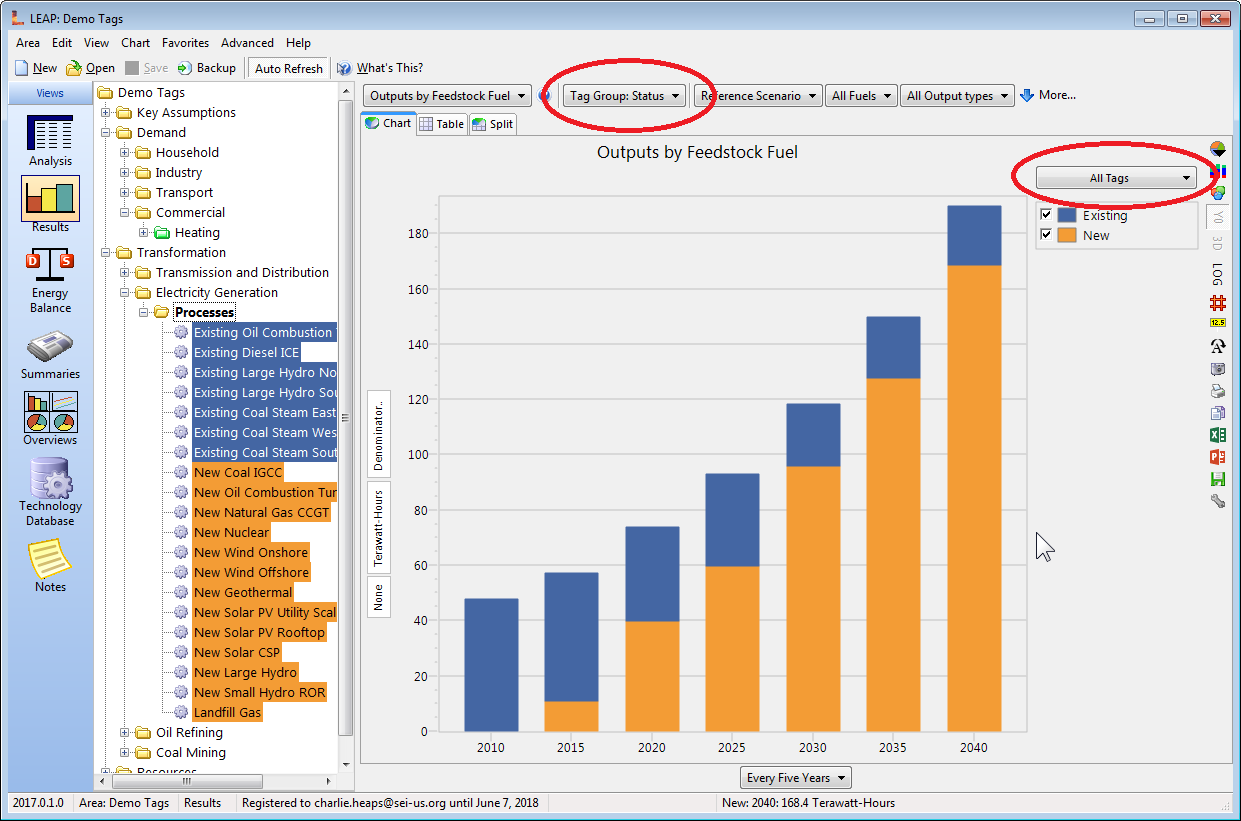
In past versions, results could be organized by the branches of the LEAP tree. In big data sets, the large number of items in the tree could make it hard to interpret the resulting complex charts. LEAP 2017 overcomes this problem by letting you tag branches, and then use those tags as an additional dimension in your reports. For example, you might assign tags to power plants indicating if they are "Existing" or "New" power plants. These tags could be assigned to a tag group named "Status". You can then display results by tag for any one tag group at a time. To further enhance results interpretation, LEAP can also now color code tree branches using the same colors used in the chart.
These new features are illustrated in the attached figure showing results organized by tag. Bear in mind that these groupings are flexible: you can create as many tags and as many tag groups as you wish.