Topic: Creating time slices to import hourly load data Subscribe | Previous | Next
Ravita Prasad 5/15/2017
Hi
I am trying to import hourly load data from Excel. In Excel I have already sorted the data "as a percentage of peak load" as shown in optimization exercise. In LEAP, I go to general, then to time slices and create a simple hourly time slice where the slices are 1 hour duration. This creates 8761 slices with the last slice having 8760-8760 name with 0 hour. I am able to import from opened Excel file the load data using "Import" tab on Yearly Shapes.
When I click on results, I get an error message saying "Zero or negative value for hours in time slices. Go to General:Time Slices to fix this".
I then went to time slices and try to delete the last slice "8761" which has 0 hours allocated to it. When I try to do this, get a warning message that this will delete all yearly shape data and if I want to continue.
How do I get only 8760 time slices so that I can import hourly data?
Appreciate your help.
Regards
Ravita
Taylor Binnington 5/17/2017


Hi Ravita -
Sorry for the inconvenience. Yes, altering your time slices will cause you to need to re-enter your Yearly Shapes data. If you have the hourly data available in Excel as a (for example) 1 * 8760 cell range, I would recommend re-importing it using the same procedure as before, after you modify your time slices to contain only 8760 slices.
Hope this is useful,
Taylor
Ravita Prasad 5/17/2017

Hi Taylor
Thank you for your advise. I had removed the last time slice (8760-8760) which had zero hour allocated to it. Then imported the hourly data and I was able to get the curve.
I have a few more queries:
1. Now I notice that, the calculation takes time. Is this because I had made 8760 time slices? If yes, then do you suggest I reduce my time slices?
2. The peak load shape that is input into LEAP was for the base year. I understand that every year, the peak load demand is bound to increase, how to I cater for this increase in the long term? My base year is 2015 and end year is 2040.
Appreciate your help.
Regards
Ravita
Taylor Binnington 5/24/2017
Hi Ravita,
Generally, running your model using 8760 hourly time-slices provide an unnecessary level of detail for scenario projections of 20+ years, and this will cause your model to run more slowly. I'd instead recommend that you pick larger time slices (i.e. fewer in each year), but which still are able to capture the general trends you observe in your load data - day/night, week/weekend, seasonal, etc.
Although you assigned the load shape in your base year, the shape itself is understood by LEAP to represent either a percentage of peak load or a percentage of annual energy requirements (depending on the shape type you have selected). This means that the relative shape of the load curve may remain the same in each year, even though the magnitude of the peak (peak MW) or energy demand (MWh) may change depending on your demand-side projections. If you wish, you may view the Transformation: Peak Power Requirements result, from within LEAP's Results view, to see how peak load is changing.
Hope this helps,
Taylor
Francis Rabulan 4/26/2018

Hi Taylor and Emily!
The same with Ravita, I tried to have 8760 slices on my time slices for Mindanao's load curve. Apparently, it has caused LEAP to run slowly and even non-responsive.
How do I setup my time slices to reflect only 24 slices (equal to that of one day)? I was looking at the Visayas model which you helped us with and it has 24 slices. Apologies as I can't recall the steps/process. The data that we have is for a year which has 8760 hours (thus the reason for setting up 8760 slices).
Thank you as always!
Raki
Emily Ghosh 4/27/2018

Hi Raki,
When determining how many time slices to use, it is important to consider how much detail that you want to capture. Is there significant variation in the load each season or each month? Are there differences in consumption at night compared to the daytime? Are there difference on weekends versus weekdays? This will help determine how many time slices to use.
If you would like to proceed with using 24 time slices like the Visayas model, you can do so by following these steps:
- Go to General --> Time Slices --> Set Up
- Select the Simple method for creating time slices, and change the Slice Duration to 365 hours (1 hr/day * 365 days/yr = 365 hrs/yr)
- You should now see 24 time slices in the Time Slices dialog box. If you see 25 slices, delete the last time slice which has 0 hours associated with it.
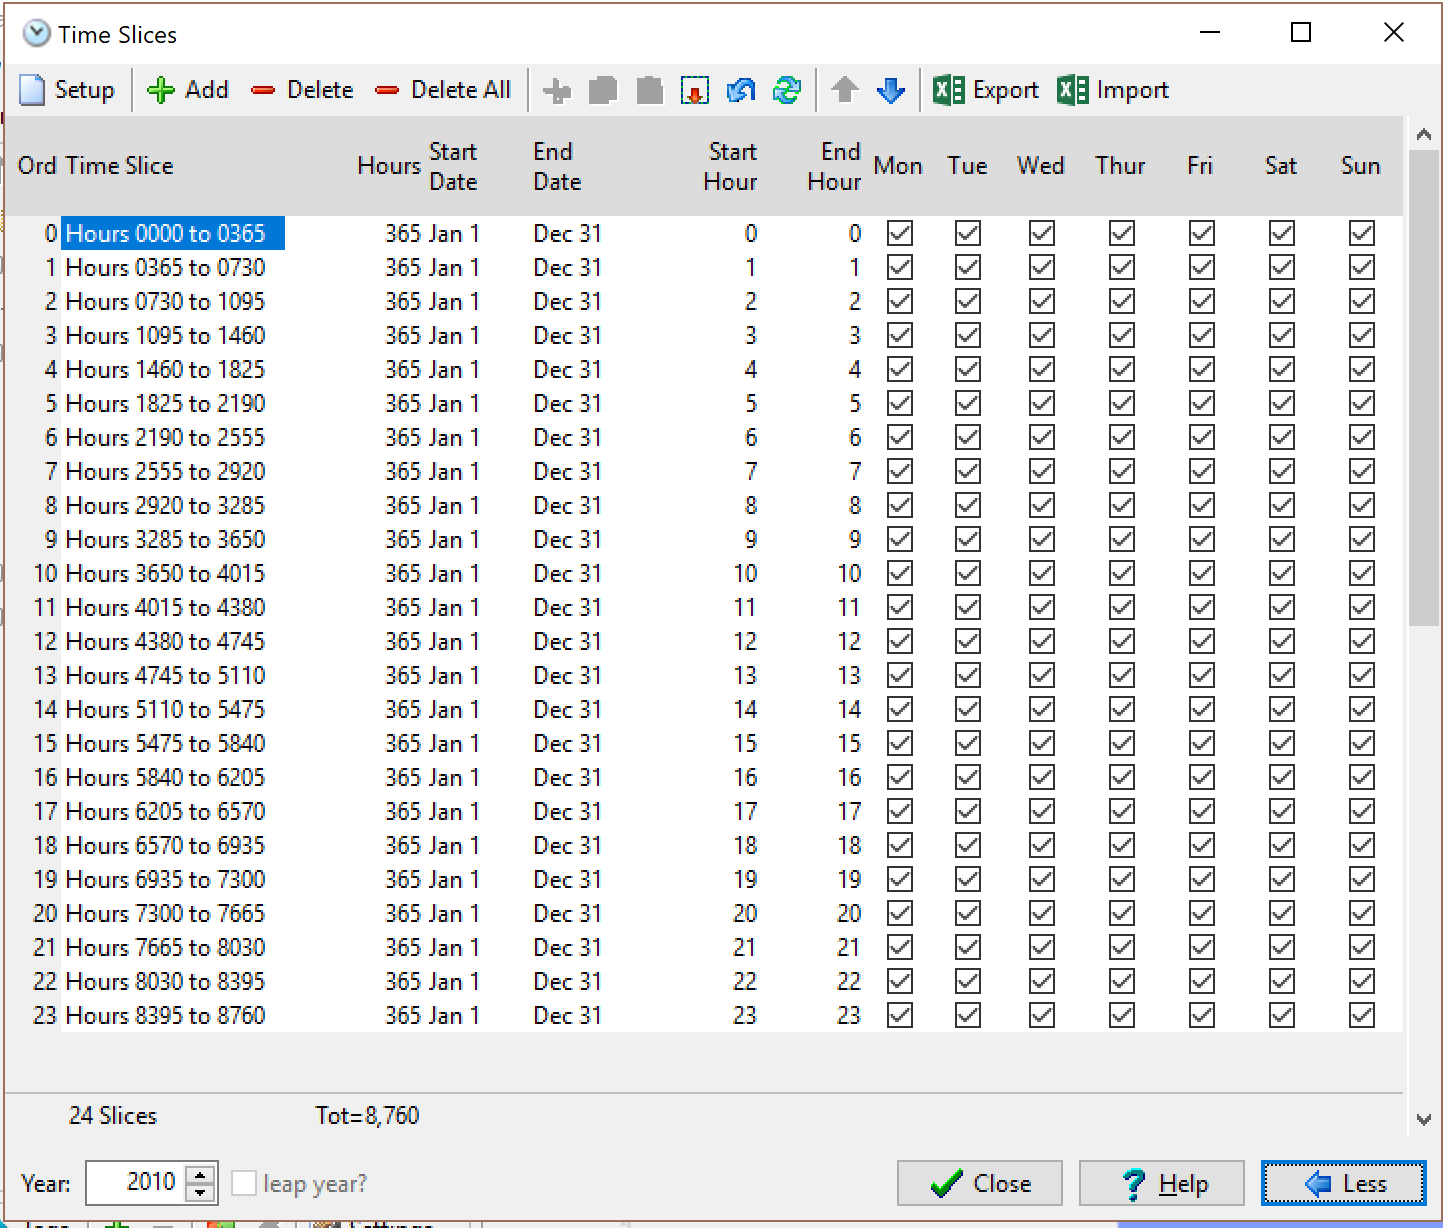
- Click on the "More" button at the bottom to add more detail to each time slice. Refer to the following diagram which shows how the start/end dates, start/end hours and days of the week should be specified for a 24-slice set up.
After you've set up the time slices, you can go ahead and import load data from Excel through the Yearly Shapes dialog box. LEAP will automatically map this data to the time slices based on how they were specified.
Hope this helps!
Thanks!
Emily
Francis Rabulan 5/16/2018
Hi Emily!
Thank you for the response. Will do this and give you a feedback. This will definitely help.
Thanks again!
Raki