Topic: Modeling Carbon Intensity Reduction Subscribe | Previous | Next
Nadia Ouedraogo 9/15/2017
1 Like Hi,
I a trying to modelise the NDC target for one country, that means a reduction of the carbon intensity (total emission /GDP) by a certain percentage.
I could find the way to do it.
I tried to construct an indicator as follow:Demand: Environment [Million Metric Tonnes,Fuel=all, effects = all]/GDP
but getting an error message
Any help on how to implement this scenario?
Thanks
Nadia
Taylor Binnington 9/15/2017


Hi Nadia - you have the right idea.
I'm not sure about the syntax of your expression, though. Try using the Branch/Variable selector to find the branch (choose the top-most branch in your model so that you caputre all emissions below it, not only those from the Demand branches of your model). You can then divide this by your GDP variable. In Freedonia, this looks like this:
Freedonia:One_Hundred Year GWP Direct At Point of Emissions[kg] / Key\GDP[US$]
You would then add or subtract policies or make changes to your model until you achieve the desired intensity.
What type of error message are you seeing?
Best,
Taylor
Nadia Ouedraogo 9/15/2017

Hi Taylor,
Thanks a lot, your answer is very helpful.
The error message was about the expression that I corrected, using the the Branch/Variable selector as advised and it works.
I would still have a question regrading the units. In Fredonia, why the GDP isn't in Billions in your example?
If I want to have the emissions intensity expressed in tons of CO2 equivalent. given that the GDP is in Billion of $us.
in Fredonia, would the expression be:
Freedonia:One_Hundred Year GWP Direct At Point of Emissions[Tonne] / Key\GDP[Billion US$] ?
Thanks for your help.
Nadia
Taylor Binnington 9/21/2017
Hi Nadia,
You may include or exclude the word "Billions" as you wish. Inside the square brackets, LEAP interprets this word as a scale modifier. So if GDP = 1,000,000,000 USD, expressions would return the following:
GDP[USD] = 1,000,000,000
GDP [Billion USD] = 1
Best,
Taylor
Nadia Ouedraogo 9/26/2017
Nadia Ouedraogo 10/9/2017
Dear Taylor,
Greetings.
Regarding you above reply, I have now constructed the indicator on the NDC, however, I didn't manage to visualise its effect on the different branches (i.e.: demand, transformations etc.).
I would like to compare its results in terme of energy demand, transformation, costs with others scenarios but do not know how
Could you please advise how I can materialise this?
Many thanks in advance with regards
Nadia
Emily Ghosh 10/9/2017

Hi Nadia,
You will need to create separate indicators for each branch to view the effect of each branch separately. If you change the first part of your expression with the branch path you are interested in, you will be able to view the indicator result for that branch and everything under it.
"Branch Path":One_Hundred Year GWP Direct At Point of Emissions[Tonne] / Key\GDP[Billion US$]
In the Freedonia data set, the Freedonia branch is the top-most branch, therefore the indicator shows the results for entire area. If you want to view the result only for Demands or only for the Household demands branch, the different indicator expressions will look like this:
Demand: One_Hundred Year GWP Direct At Point of Emissions[Tonne] / Key\GDP[Billion US$]
Demand\Households:One_Hundred Year GWP Direct At Point of Emissions[Tonne] / Key\GDP[Billion US$]
You can find the branch path just below the main toolbar where it says "Branch:". You can also use the Branch/Variable wizard to assist in creating your expression.
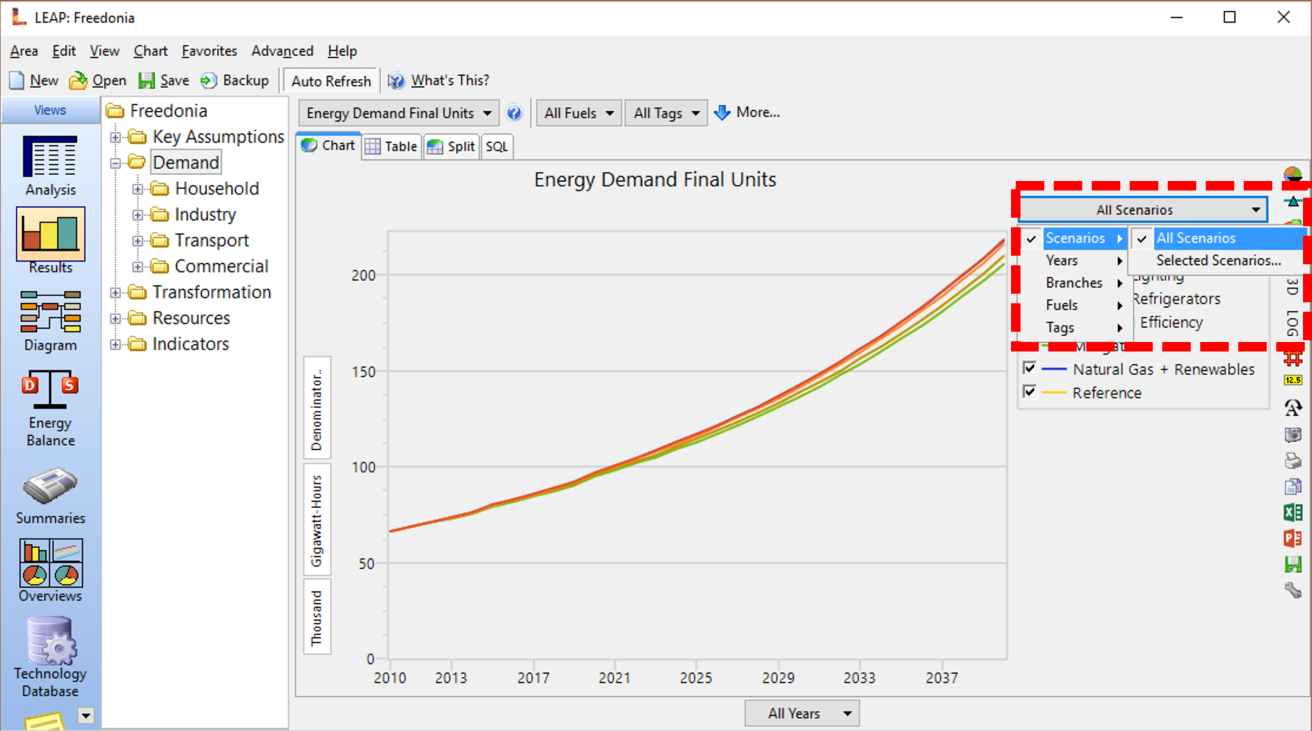
With regards to your question on comparing results between scenarios, you can do this in Results View by clicking on the Legend drop-down and selecting All Scenarios (refer to the attached screenshot for details).
Hope this helps!
Emily
Nadia Ouedraogo 10/9/2017
Hi Emily,
Thanks so much for your quick reply.
I am not sure I get it correctly.
I create separate indicators for each branch to view the effect of each branch separately.
However, I still can' visualise their effect integrated to my different secnarios.
E.g.: I have the reference scenario and another on energy efficient. the four scenario consists on the INDCs that I can only modelled as an indicators.
Once I construct this scenario (2 indicators for the demand and transformations branches). How can I see the demand of energy, the costs of transformation (demand and resources) for example for this scenario as for the reference scenario and be able to compare the different values.
The INDCs modelled appear only at the indicator branch and their is only the emissions values that appear.
You can visualize what I get currently with the attached screenshot .
Thanks for your help
Nadia
Emily Ghosh 10/23/2017
Hi Nadia,
I apologize for the delay in responding. Unfortunately, I am unsure of the exact issue that you are having. Do you mind re-sending the screenshot? It was not attached in your reply.
Thanks,
Emily