Topic: Conducting Decomposition Analysis in LEAP Subscribe | Previous | Next

10 Likes
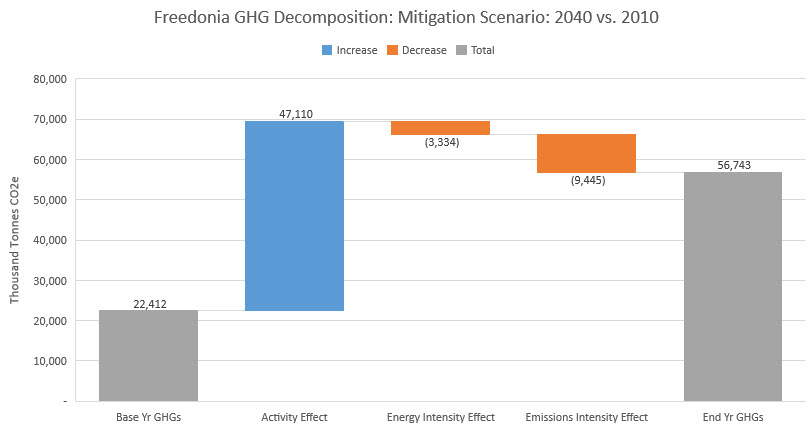
Have you ever looked at your scenario results in LEAP and wondered "why are my emissions growing (or declining)?" Decomposition analysis can be used to communicate the changes in activity (e.g. population or GDP growth), energy intensity and emissions intensity that, put together, cause the overall emissions trend. LEAP's results are already based on a flexible disaggregated breakdown of these factors, but until now there was no easy way to communicate such decomposed results.
To address this, we have created a simple .vbs script that will export relevant results from a LEAP data set and then construct a "waterfall" chart that decomposes the change in energy sector emissions into its activity, energy intensity and emission factor components. The script is based on the LMDI approach developed by Professor B.W. Ang and colleagues at the Energy Studies Institute, National University of Singapore. See Ang's guide to this topic here: https://bit.ly/2qW564O.
The script can be run in two modes by setting a simple 1/0 switch in the script. Mode 0 decomposes the change in emissions from the base year to the end year of a particular scenario. Mode 1 compares the end years of two scenarios.
The script should work for most LEAP data sets, and could easily be adapted to do more (e.g. a more detailed decomposition or a decomposition of only particular sectors). It could also be adapted to work on multi-regional data sets. Currently, it compares changes in 100-yr GWP GHGs, but this could also easily be changed to show other pollutants.
Get the script here: https://bit.ly/2HYZqhM
Unzip this file into your LEAP common scripts folder (normally AppData\Roaming\SEI\LEAP\_Scripts)
To run the script, select it from the Advanced: Run Common Script menu in LEAP. The script creates a complete Excel spreadsheet from scratch, exports relevant data from LEAP to Excel and then generates the waterfall chart. Please note that you do need Excel 2016 installed on your PC as well as LEAP. Earlier versions of Excel cannot generate waterfall charts unfortunately.
Please give it a try and let us know what you think!