Topic: Scenario graphs Subscribe | Previous | Next
Hafsa Wahid 9/11/2018
Taylor Binnington 9/26/2018


Hi Hafsa -
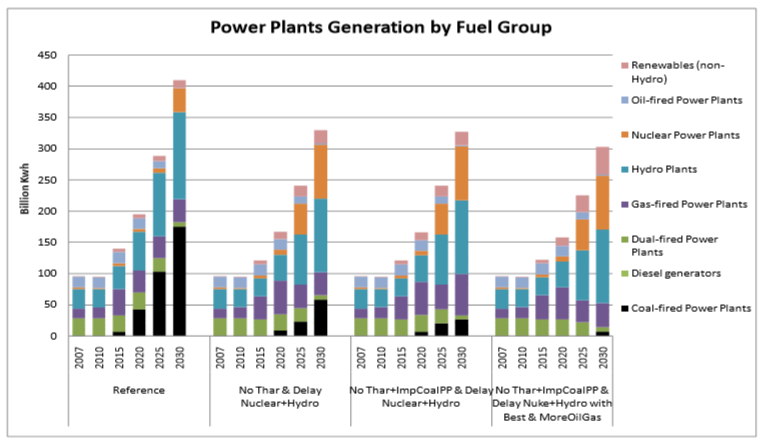
That type of graph is not possible to generate in LEAP, because the x-axis displays two different dimensions: years as well as different scenarios.
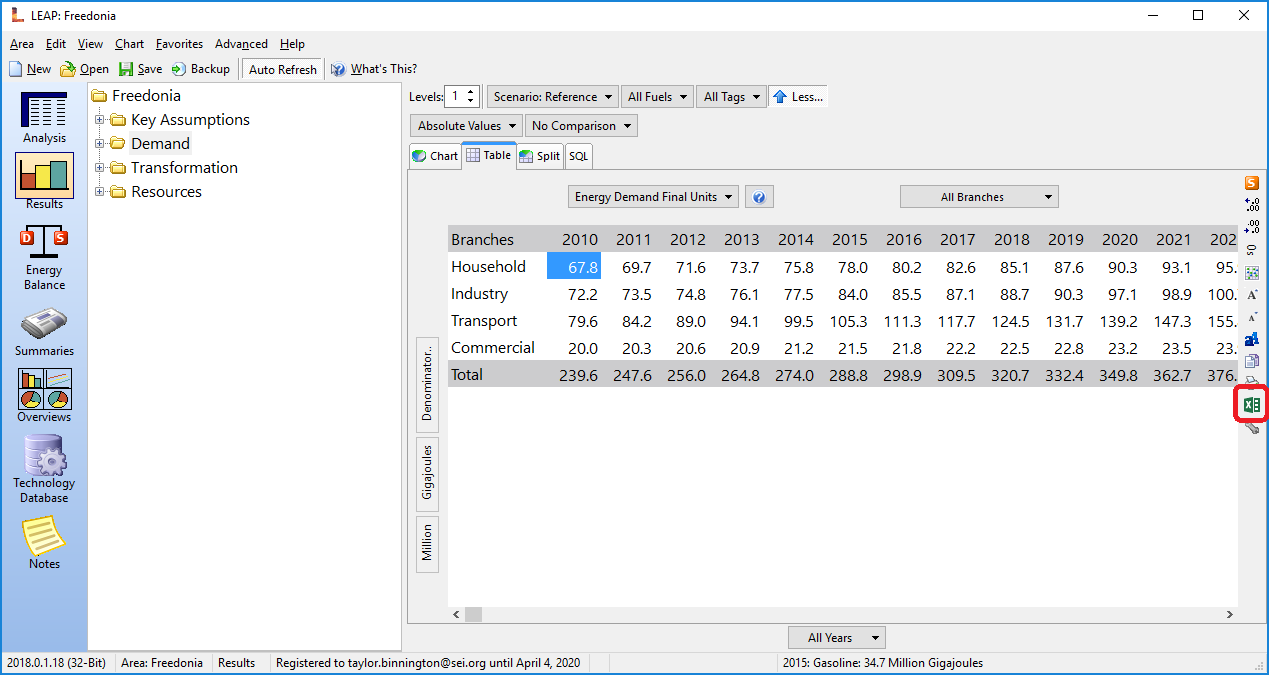
You would need to export the table result to Excel by clicking the "Excel" button in the Results view. See the red-circled interface option in the attached picture.
Best,
Taylor