Topic: Interp Subscribe | Previous | Next
Maha Alsabbagh 11/15/2018
Hi there
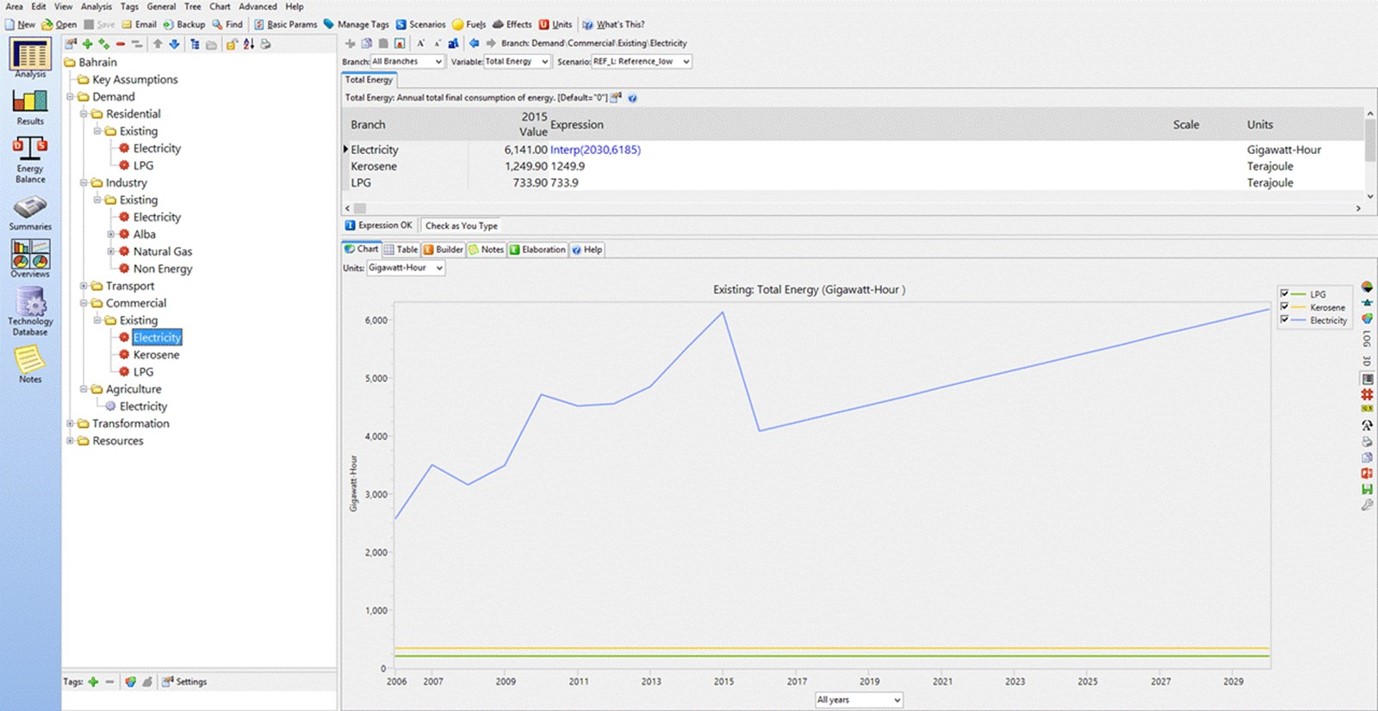
I have the actual electricity consumption figure for the commercial sector in 2015 (6141 GWh) and the projected figure for 2030 (6185 GWh that shows the impact of electricity tariff reform). When I used the 'Interp(2030,6185)' function I noticed the significant drop in electricity consumption in 2016 (attached).
My question is: why do I get this drop? Is it possible to get a smooth line instead (without just entering 6185 with no function)?
Many thanks.
Taylor Binnington 11/15/2018


Maha Alsabbagh 11/17/2018