Topic: Yearly load shapes issue Subscribe | Previous | Next
Pedro Gerber 1/23/2019

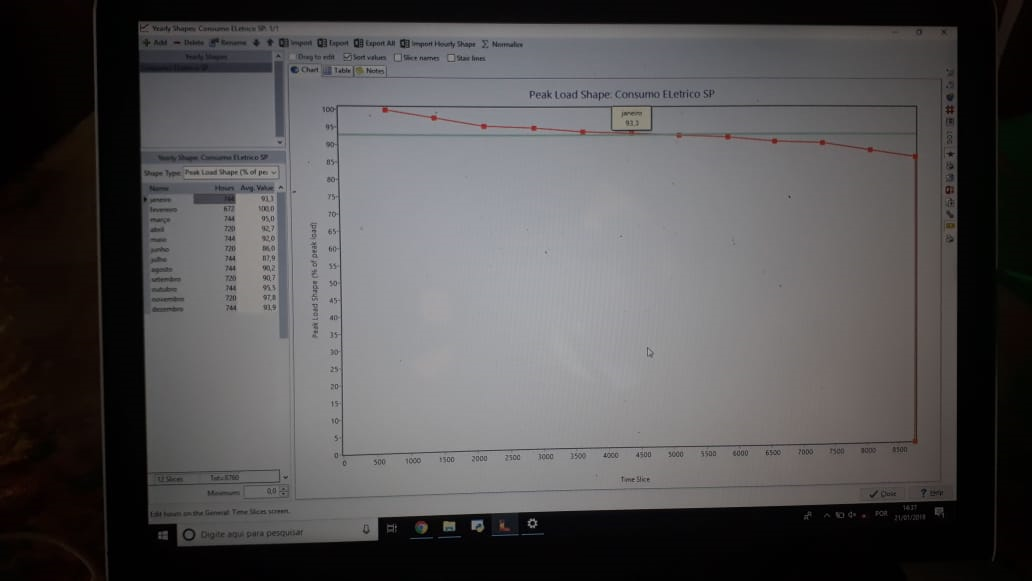
Hello everyone, I am trying to build the yearly load shape for my project (data atteched), but this is what I am getting (picture atteched): Am I doing the time slice wrong?
I thought it would show the yearly peak load shape, by month (% of peak load).
 RelSAMPRegiaoEmp_2014.xlsx [6]
Emily Ghosh 1/23/2019


Hi Pedro,
If you change the view from "Sort Values" to "Slice Names" (located just above the chart) you should be able to see the load shape by month.
Thanks!
Emily
Pedro Gerber 1/24/2019

Thank you very much! I didnt know it was that simple. Sometimes the simplest problems keep us up all night.