Topic: Peak Load data and reserve margin Subscribe | Previous | Next
Nur Adhyaksa 3/20/2019
Hello team,
There are several question i would like to ask :
- Due to limited source of data, is there any possible way to use Peak Load data directly without using annual Energy Load Shape ?
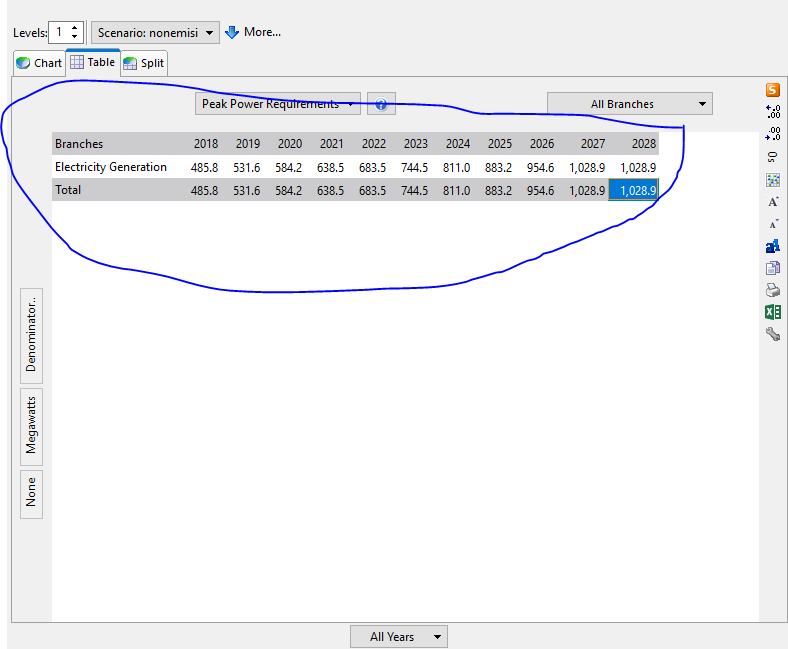
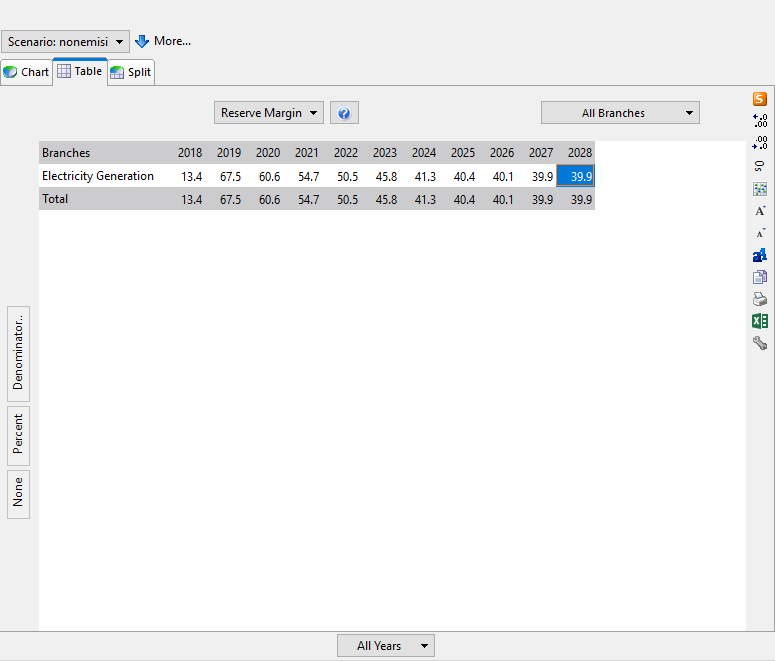
- And somehow, i manage to manipulate my Energy Load Shape data so my Peak Load met at desired value (trough trial and error), but there is something i didn't understand. The reserve margin result is way out of calculation as you can see in the picture. Correct me if i'm wrong
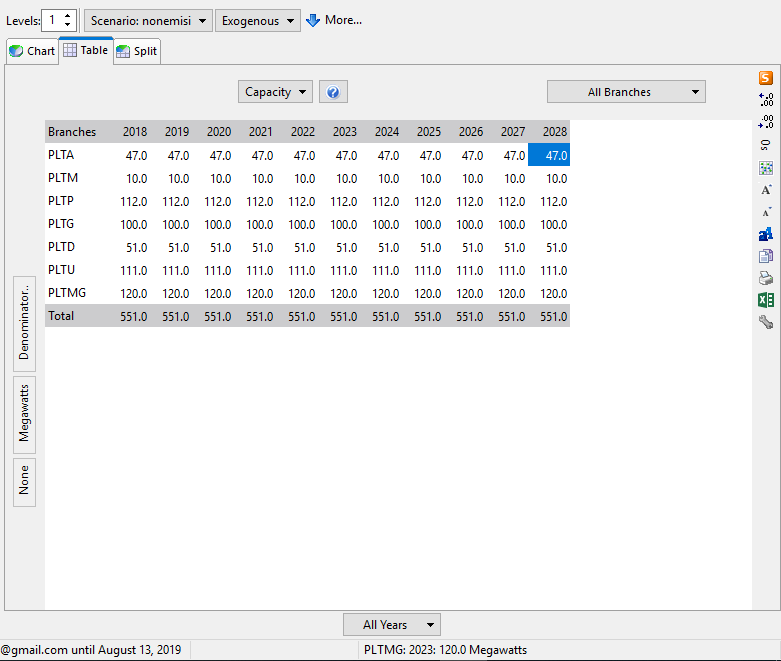
- The other thing is as you can see in the 2nd picture, my capacity is not expanding due to demand growth. I already set optimization to LCOE but it doesn't seem to run. I set reserve margin constraint to 30%. What cause this ? Thanks in advance !
Best regards
1 Like Hi Nur,
Here are the answers to your questions:
1. Yes, you can enter the Peak Load data. To do this, go back into General: Yearly Shapes and create a new shape. Then from the Shape Type drop-down menu, choose "Peak Load Shape (% of peak load)" and enter your data. Once you have created your load curve in LEAP, remember to reference it in your electricity generation module under the variable called "System Peak Load Shape".
2. The Reserve Margin appears to have been met since the values you are seeing are above the planning reserve margin of 30%. Refer to the following thread which answers what you are seeing in more detail: https://www.energycommunity.org/default.asp?action=9&tid=3762&fid=22
3. In the drop-down at the top of Results View, make sure to select "All Capacities". In the screenshot provided, it appears that you are only looking at Exogenous Capacity. The Exogenous Capacity represents the capacity that you specify in Analysis View. You will need to also look at Endogenous Capacity - this is the amount of capacity added endogenously through LEAP's calculations. All Capacities represents the total capacity of a process (so the endogenous + exogenous capacity).
Hope this helps!
Emily
Emily


