Topic: Transport analysis Calculations. Device stock and retirements Subscribe | Previous | Next
Iñigo Muñoz 2/13/2020
Dear all,
I am trying to understand how LEAP performs the stock calculations when conducting a transport analysis.
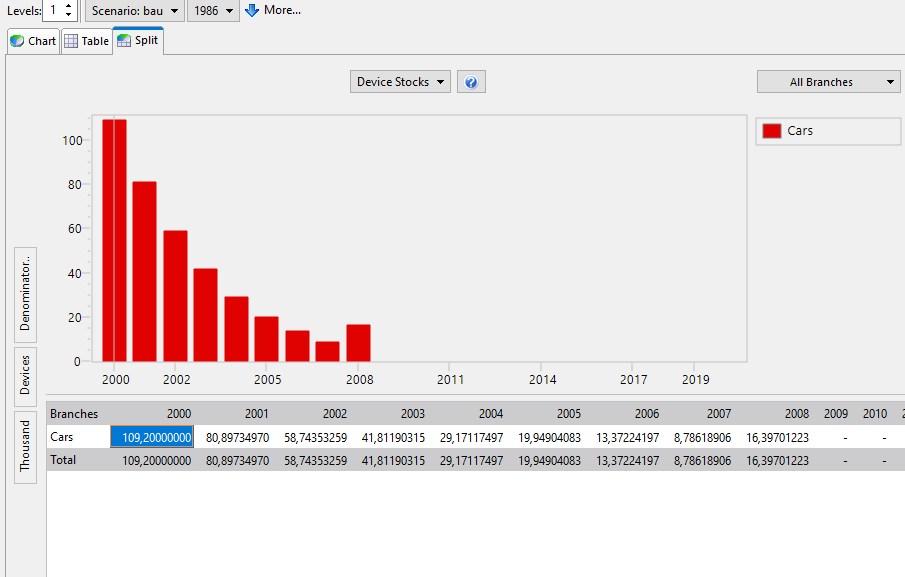
Following the transport exercise in the LEAP's guide (spanish version) I don't understand how it is possible that the stock of an old vintage can increase the year before being completely removed (see attached image) while following a decreasing survival profile.
I attached the LEAP file and the excel file where I try to reproduce the calculations performed in LEAP.
I also have had issues in understanding how retirements are calculated: are they not calculated following this formula?:
Stock (t) = Stock (t-1) + Sales (t) - Retirements (t) -> Retirements (t) = Stock (t-1) - Stock(t) + Sales (t) (with t: year)
Thanks in advance
Attachments:
>>I am trying to understand how LEAP performs the stock calculations when conducting a transport analysis.. I don't understand how it is possible that the stock of an old vintage can increase the year before being completely removed (see attached image) while following a decreasing survival profile.
>>I also have had issues in understanding how retirements are calculated: are they not calculated following this formula?:
>>Stock (t) = Stock (t-1) + Sales (t) - Retirements (t) -> Retirements (t) = Stock (t-1) - Stock(t) + Sales (t) (with t: year)
Thanks for the questions. A few points to consider:
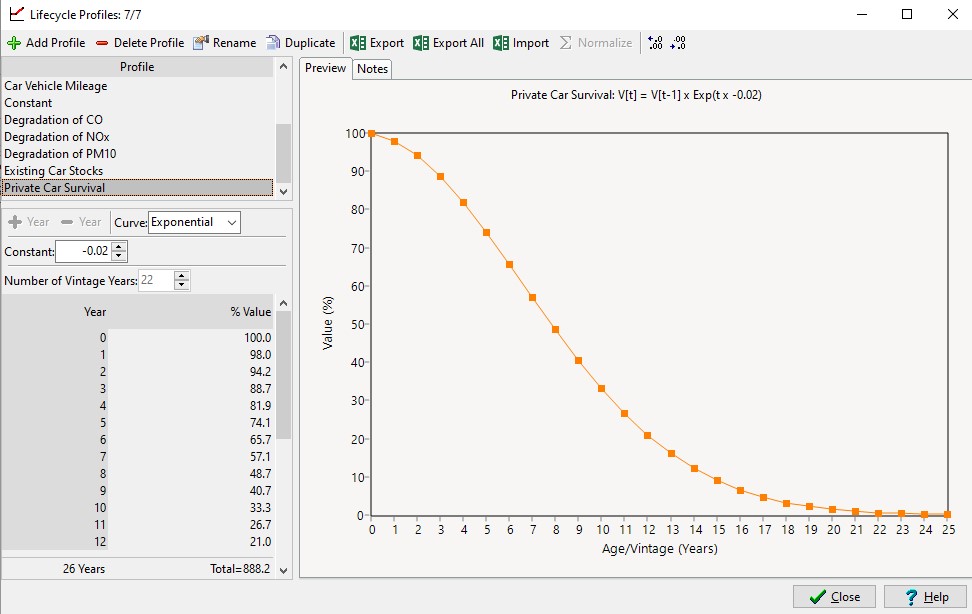
Firstly, retirements are not calculated from stocks. Rather, stocks are what is left over after retirements. Retirements are specified using a "survival profile" that specifies what percentage of a particular vintage (i.e. cars of a certain age) are retired in any given year. These survival profiles always have a value of 100% in year zero, and then gradually decline as the vehicles age increase. Typically (in the US) most cars are retired after about 15-20 years. So the profile may look something like the one attached here. Look at menu option General: Lifecycle Profiles to see these..
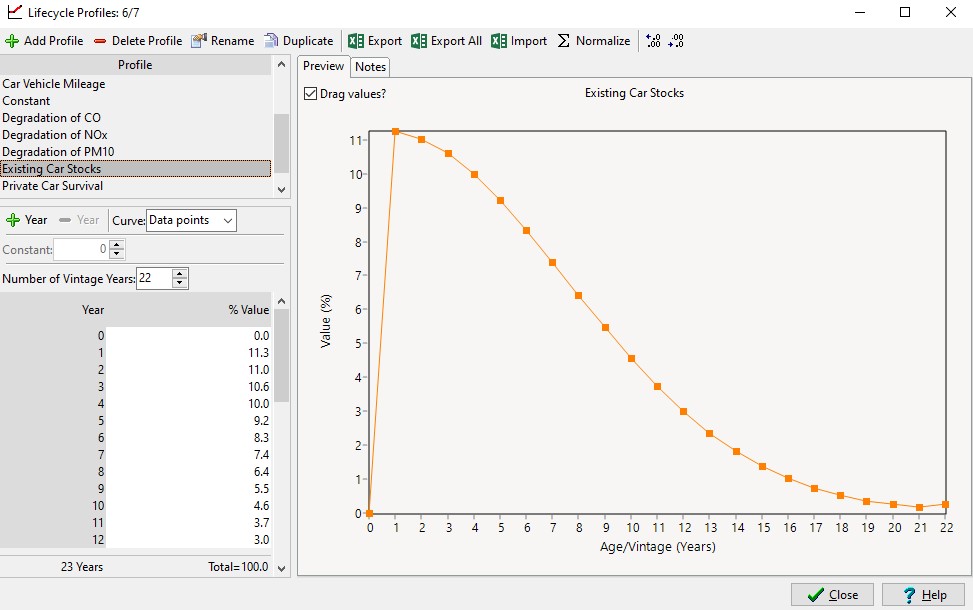
Secondly, in order to do its calculations, LEAP needs to keep track both of the total stock of each type of vehicle, and the "vintages" of vehicles (i.e. how many cars there are purchased in each earlier year). The actual calculation assigns vehicles to "bins" for these vintages and to keep calculations manageable (and to to not consume too much memory), the final bin is used to hold all vehicles of a certain age and older. When setting up the model, you need to specify the initial distribution of stocks in the base year using a "stock profile". See the attached example from the transport exercise. Note how the value for the last year (22) of this profile is slightly greater than the value for the penultimate year (21). That's because the final value really means 22 years OR OLDER, so it includes vehicles that are 23, 24, 25, etc. years old.
Hopefully, this explains how it is possible that the stock of an old vintage can increase the year before being completely removed.
Incidentally, stock profiles must have a zero value in year zero. That's because the year zero stocks come from the sales values you provide elsewhere.
Hope this helps - thanks for a great question!
Charlie
Dear Charles,
Thanks for your reply. I am now aware how the survival and stock profiles work and how the last vintage regroups vehicles of a certain age and older.
However I am still unable to reproduce the calculations performed by LEAP. I attach two screenshots where I show my problem:
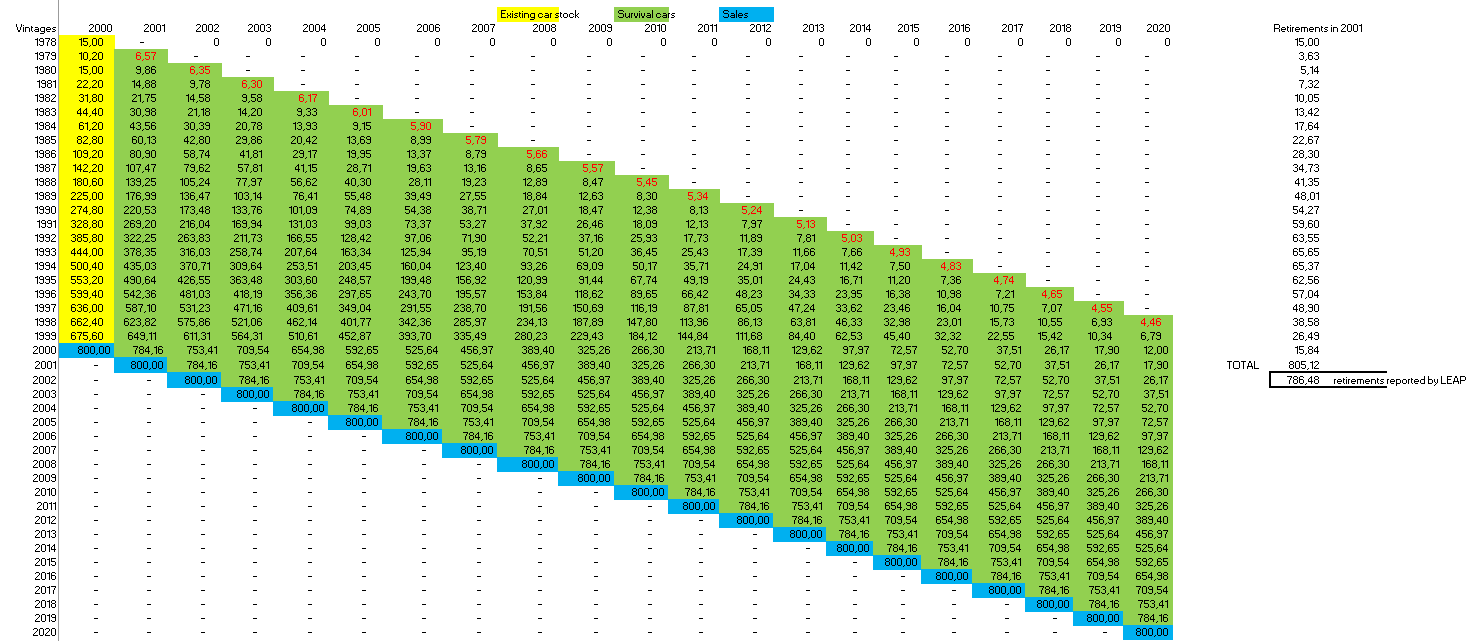
In the first one I calculate the stock evolution of the different vintages. Yellow values are calculated through the stock profile for the base year, while green values are calculated following the survival profile. Blue values show the sales for a specific year.
The second screenshot shows the results given by LEAP. I manage to reproduce all the results except for the numbers marked in red which are the ones for the last year of a given vintage. If this difference comes from the "older" cars of the last vintage, how it is calculated?
I also have problems with the retired vehicles. While LEAP reports 786,48 retirements in year 2001, I am not able to reproduce this result even with the correct stock results (screenshot nº2).
Thanks for your help
Iñigo
PD: I also attach the excel file where I perform my calculations
Attachments:


