Topic: Data for peak load shape Subscribe | Previous | Next
Ankur Sharma 7/3/2020
Hi all
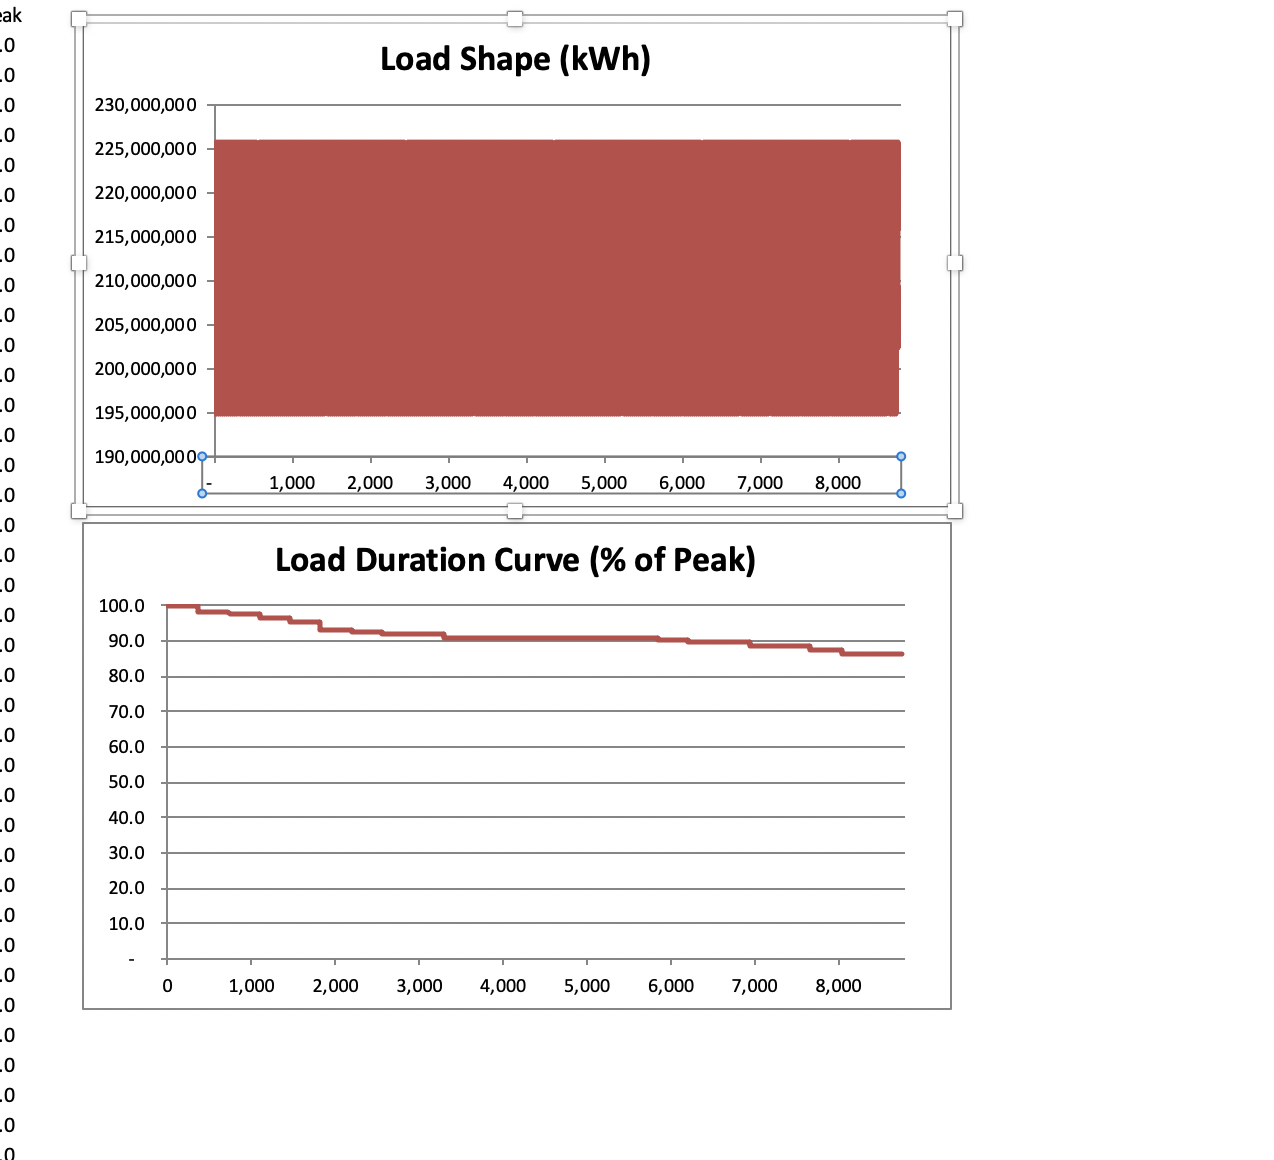
I am doing modelling for India and have been able to find data on the load curve for a typical day but don't know how to convert this into the percent of peak load data which is needed for the yearly shapes in LEAP. I found data for a typical 24 hour day and I tried to replicate this for 8760 hours. Does the shape look normal for a modelling work ? I am attaching it here
Any help would be much appreciated
Ankur