Topic: Hourly generation profiles and quickly ramping down coal-fired power plants Subscribe | Previous | Next
Jose Antonio Ordonez 10/7/2021

1 Like Dear all,
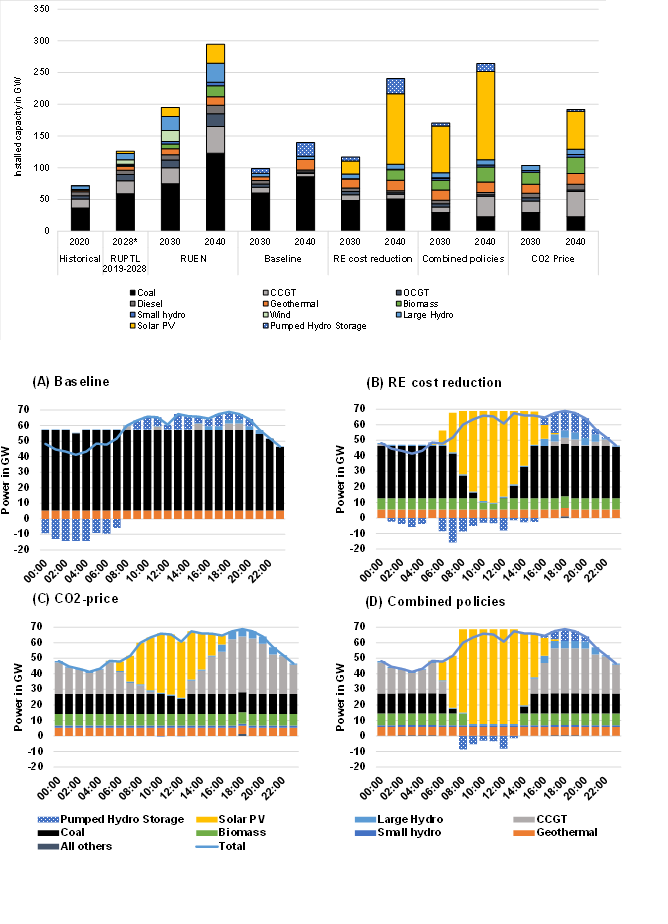
Hope this message finds you well! We were wondering, we cost-optimized Indonesia�s power sector unitl 2040 assuming a slow and quick decrease in costs for renwables, each with and without carbon tax. The results look amazing, but I see that the modell assumes a quick ramping of coal-fired capacities when solar PV generation kicks-in at sunlight, while geothermal and biomass power plants keep their load constant (for the scenarios with high shares of solar PV). Now, one can�t just ramp down a coal-fired power plant to zero, table 1of this IRENA report has a great overview of ramping times and minimal load but also the fact that instant starts is assosiated with additional costs:
https://www.irena.org/-/media/Files/IRENA/Agency/Publication/2019/Sep/IRENA_Flexibility_in_CPPs_2019.pdf?la=en&hash=AF60106EA083E492638D8FA9ADF7FD099259F5A1
Well, in any case, if the ramping time is not properly considered, neither are the resulting minimal costs, which are a function of the generation, and thus the capacity mix, and all results (at least for scenarios with very high shares of solar PV) would be questionable.
What is your take on this? Enclosed the figuers for the resulting capacity mix for different scenarios and years, including 2040, as well as daily generation profiles for a sunny day in the dry season in 2040. We are writing a paper on this, it was great fun and highly interesting to analize the futuer of coal and renewables in Indonesia.
Thakns and best rergards
Jose - Fraunhoer ISI, Karlsruhe, Germany
Charlie Heaps 10/14/2021


1 Like
Yes - completely agree with you. LEAP is not quite to the point where it can be used as a full production cost model. I will let Jason reply in a bit more detail, but I can say that this is on our roadmap of intended changes to LEAP and NEMO: namely allowing more detailed time-slicing (perhaps 10 or 15 mins) and adding additional variables to the optimization calculations for ramp rates and related variables.
P.S. I like those charts - perhaps worth noting that the latest version of LEAP natively supports showing charts like that (with years and scenarios on the X axis).
P.S. I like those charts - perhaps worth noting that the latest version of LEAP natively supports showing charts like that (with years and scenarios on the X axis).