Topic: Power Generation Results Subscribe | Previous | Next
Deborah Cnossen 12/5/2021
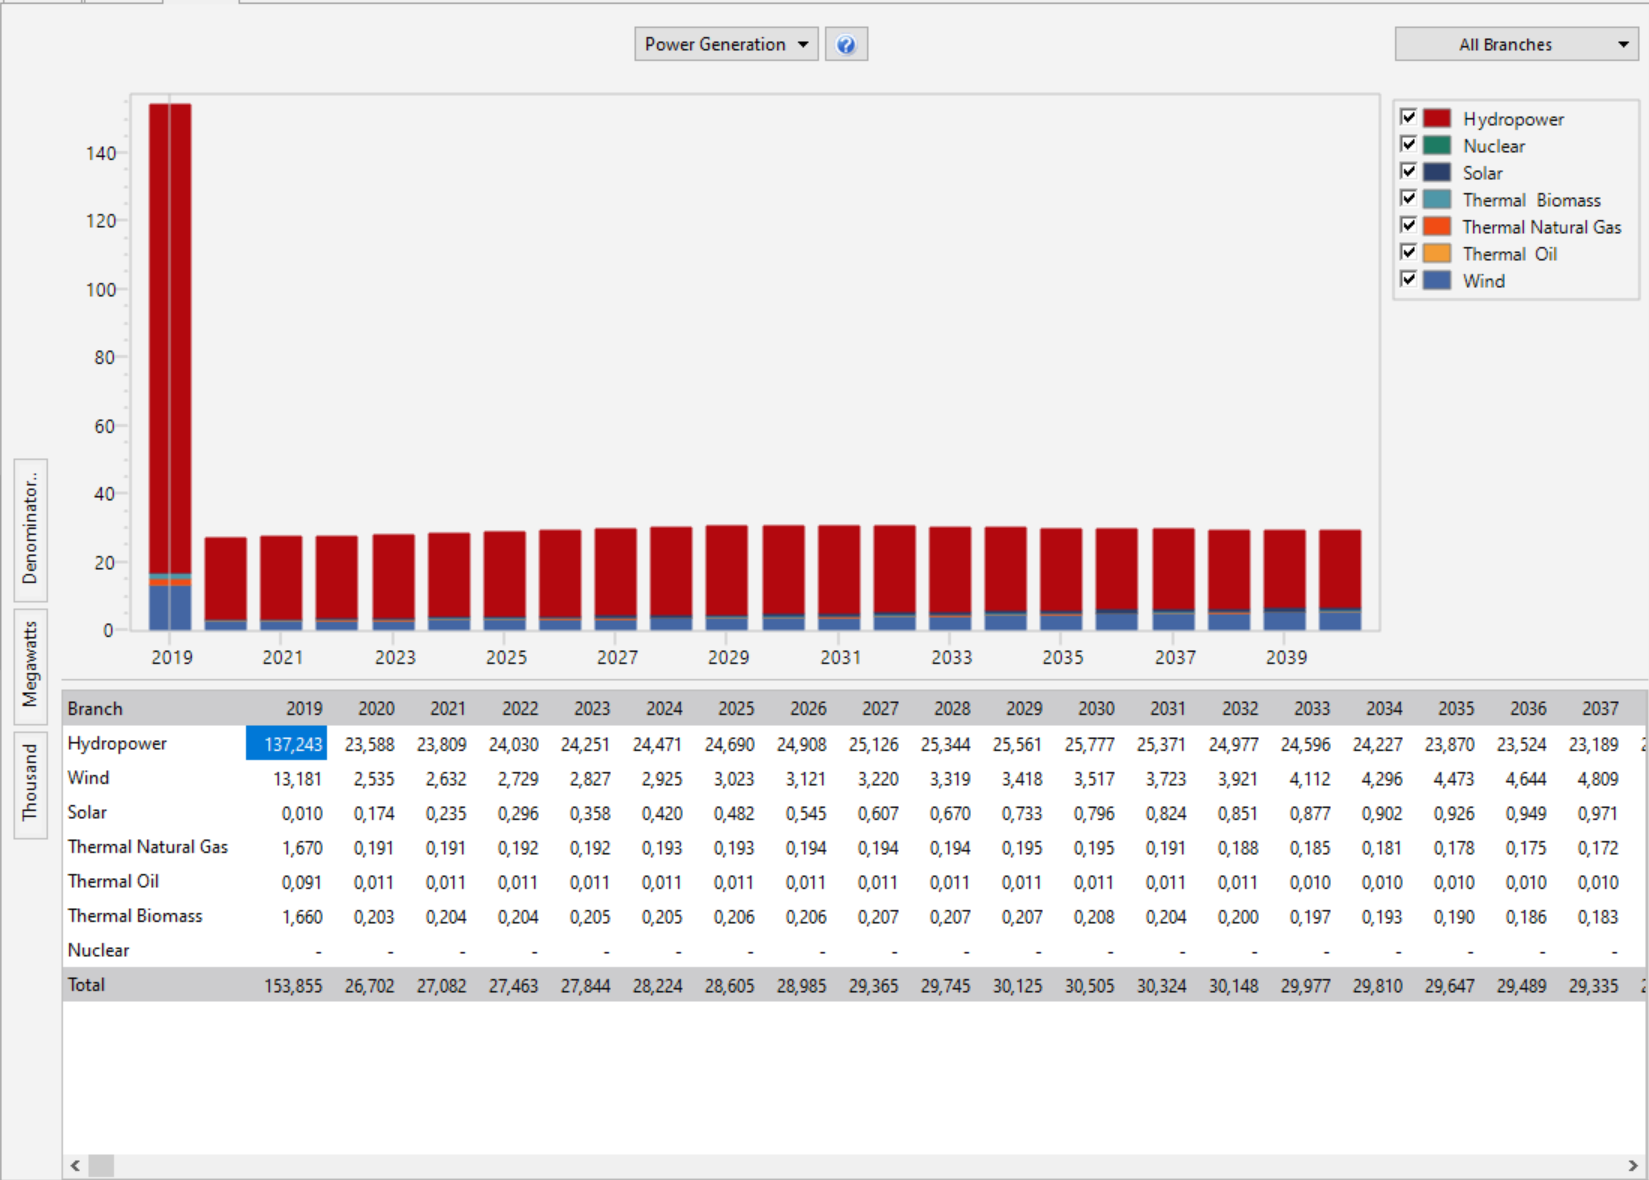
I have an issue within the results tab on the total power generation. For some reason it plots the current accounts year just fine, but the rest of the time period looks weird, almost like it's skipping something and doesn't add that to the final total. I have attached a picture of the issue.
I think I have missed something in the analysis. I put in the historical production and the capacity in the Current Accounts and used the interp function in the Business as Usual scenario to indicate an increase in production capacity and left the historical production as it was. I honestly don't really know where the problem could be and I was hoping someone on here could help me out!
Thank you in advance!
Thank you in advance!
Robert Brecha 12/15/2021

Hi Deborah,
What do your capacities look like (not just generation) and what are your capacity factors?
Nadia Ouedraogo 12/19/2021

Hi Deborah,
Were you able to find the issue with your model?
I am having the same!
Thanks!
BR,
Nadia
Nadia
Charlie Heaps 2/7/2022

This kind of figure often indicates that your demand data is not well matched with your Transformation data. One possible explanation is that the plant were run to near full capacity in the base year due to the data you input in the historical production variable. But in your scenario you may be dispatching only to meet the demands seen by the module which seem to be much less. Check the requirements on the module to see how they compare to the base year historical production you specified for Current Accounts.
Hope this helps and sorry for slow response.
Aris Suryadi 2/12/2022

Why did this picture happen? Is it because you entered the wrong generator data or other parameters. Looks strange the data you present.