Topic: Marginal Abatement Cost Curves Subscribe | Previous | Next
Ugur Gurel 4/6/2022
Dear person reading this,
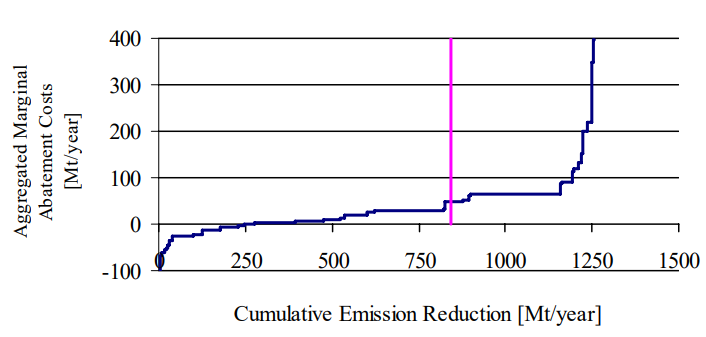
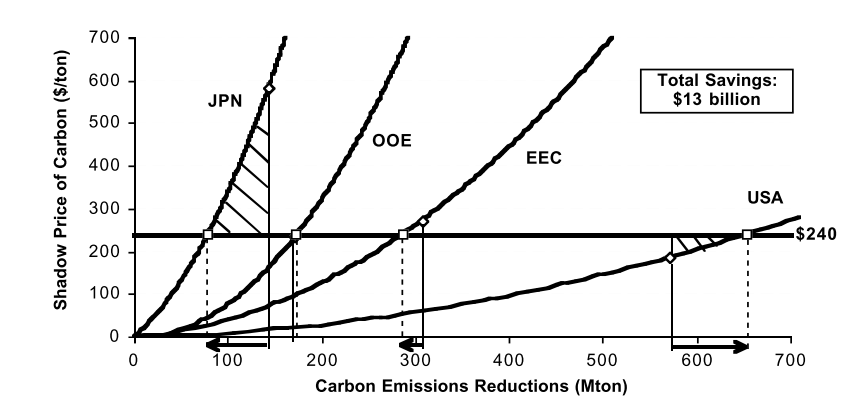
My master's thesis's focus is calculating revenue obtained from emission allowance auctions in Turkish ETS, which has not existed yet. I think LEAP might be helpful to determine emission allowance price because the available data for Turkey is generally current technology used and possible options in the future at the sectoral level. However, I think LEAP provides an output that looks like a gradually increasing line shown in the figure expert-based MACC(on the left-hand side). This one covers all sectors at once, so it is impossible to observe emission allowance exchanging between sectors. The other figure (on the right-hand side), called Model-Derived MACC shows each sectors' MAC curve and provides an equation for each one in form of M:2000-2E, which makes it possible to observe emission trading between sectors. My question is whether, using LEAP, ı can get a line looking like in Model Derived MACC for each industry or at least an equation for each sector.
Sincerely yours