Topic: Problem with Base Year Results Subscribe | Previous | Next
Nour Shihabuddin 6/23/2020
Hello,
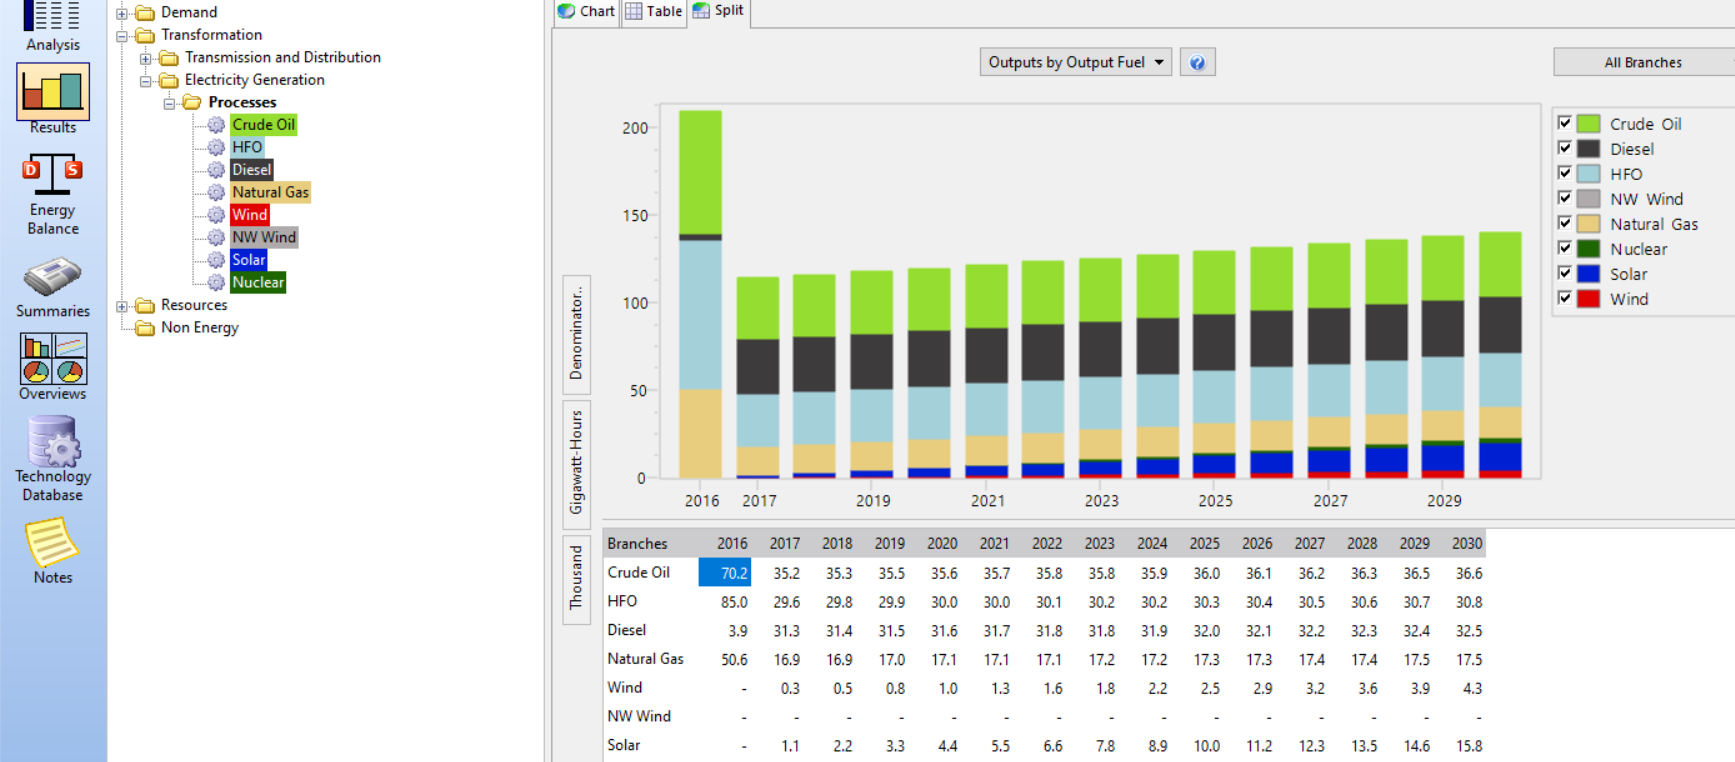
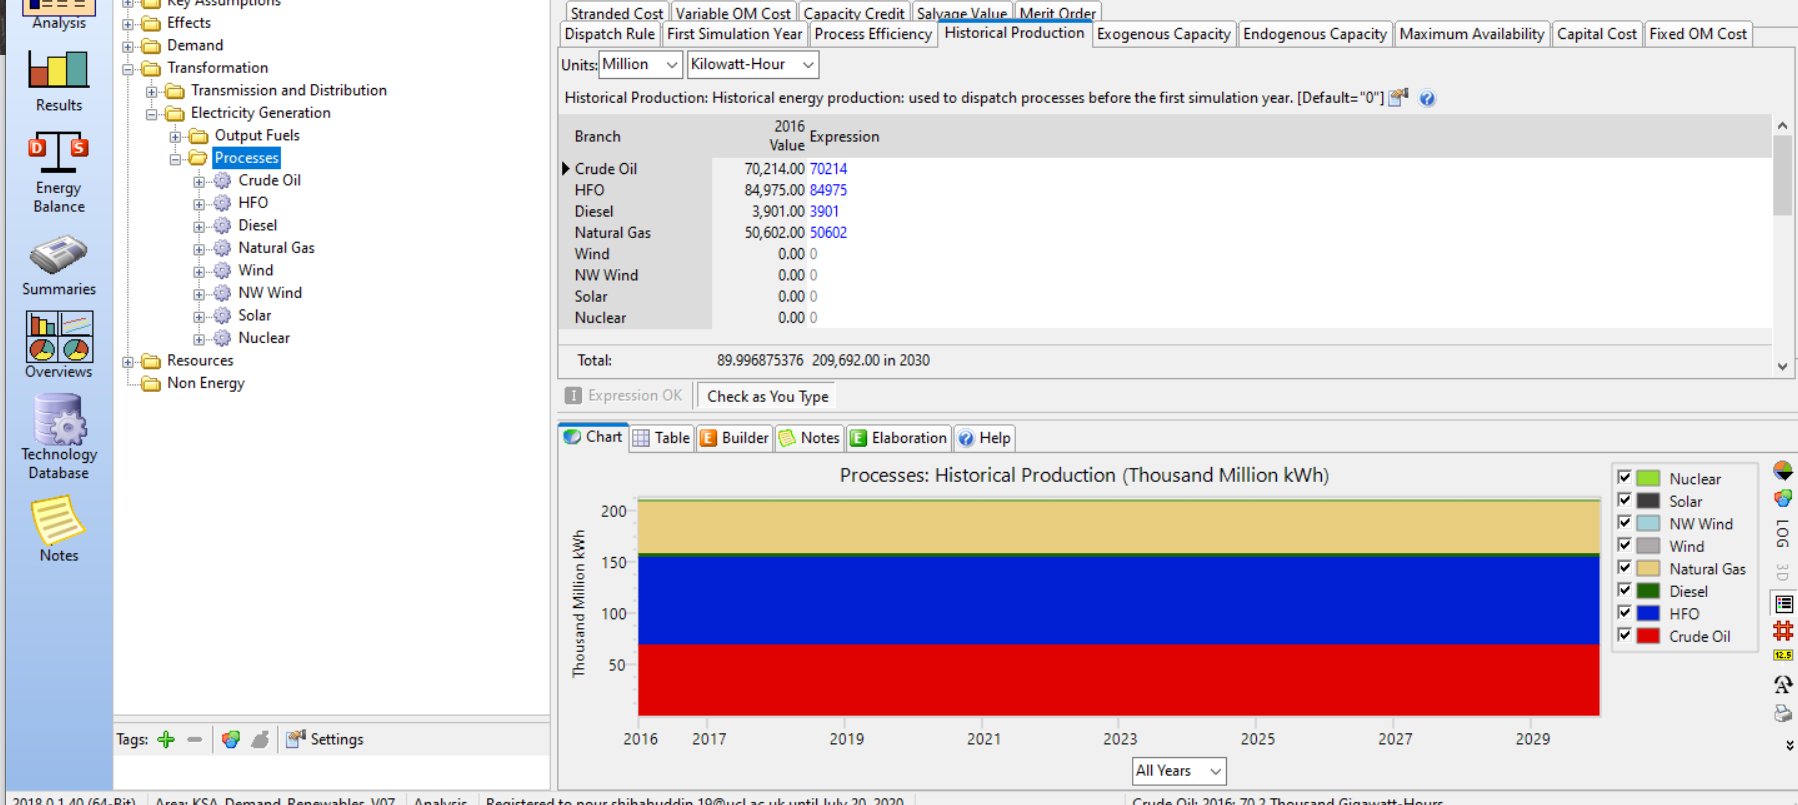
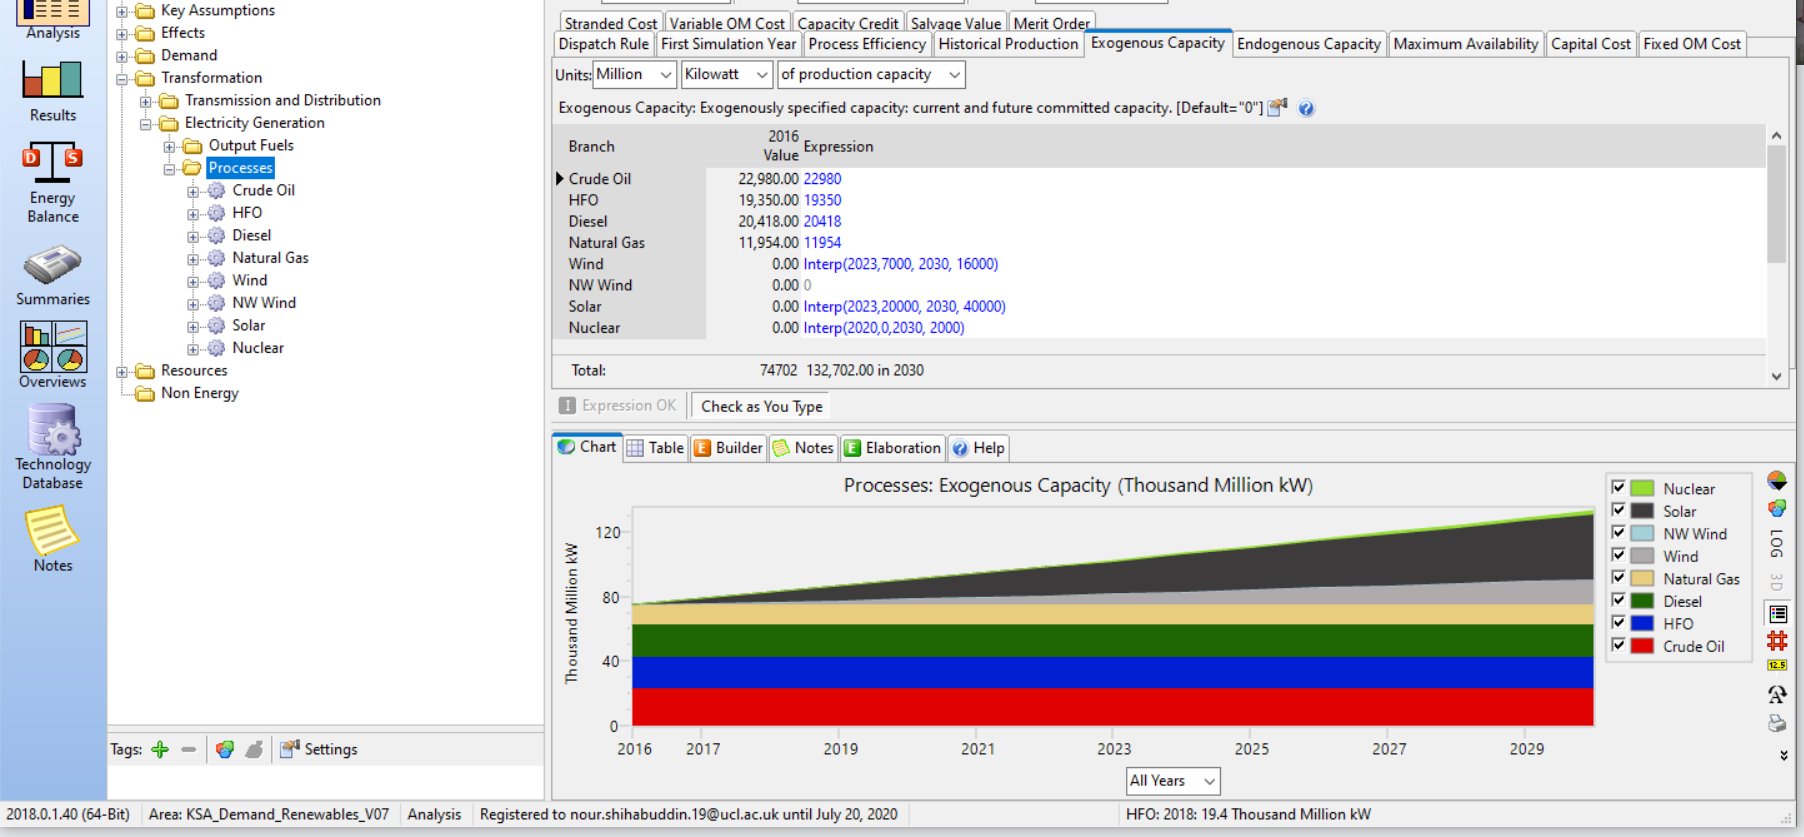
I am having issues with the results generated for my model. on the supply side, I entered the technologies I am looking into, historical generation for that year (2016), exogenous capacity and all other required inputs except Endogenous capacity. When I run the model using a MeritOrderDispatch expressions, I do not get any results for the base year 2016. Can you please advise what I could be doing wrong? I attached screenshots for your reference.
Thank you!
.png)
.png)
.png)
Charlie Heaps 6/24/2020


Hard to tell from those screenshots, but could this perhaps be a problem with units? Your last chart shows 2017 generation of about 90 TWh, but you historical production in 2016 is 3840 MMBTU (about 0.0011 TWh), so what looks like a zero in the last chart may just be a REALLY small number.
Nour Shihabuddin 6/25/2020
Thank you very much! it was a problem with the units. But I do have another problem now that I cannot seem to overcome. My generation output drops from 2016 onwards very sharply and I'm not sure why. I used the same historical production for both current account and reference scenario, I'm not sure why the sudden drop in output from 2016-2017. is there something I am missing in the model ? I attached a screen shot for your reference.
Charlie Heaps 6/25/2020
I'm afraid there is not enough information to go on with these screenshots. There could be a number of reasons why the output drops in the first scenario year. One possibility is that in the first scenario year, the processes are being run to meet demands - they are not simply run to reflect historical production. If demand is not matched with the historical generation (i.e. it is less) then you may see a sudden drop. But this all depends on what simulation methods you have used in your model.
By the way, please take a look at these guidelines on submitting support questions: https://leap.sei.org/default.asp?action=184 They are quite helpful!
Best,
Charlie
Dany Wehbeh 6/29/2020

Hi Nour,
It is really hard to tell why LEAP is giving this output without looking at your demand data. Perhaps what LEAP is generating in terms of energy is sufficient to meet the demand data that you have entered. To make sure that this is not the case, check if LEAP is importing energy into the module.
Muhammad Reza 5/29/2023

Hi Nour, it appears that there may be a need to consider adjusting the initial simulation year in the processes of each generation, if I may kindly suggest.
